First Siam

Python USES Deep Neural Networks to Identify Siamese and British Short.,首發(fā)于Cobub。
]]>First Siam
Second short

Have you ever been able to identify Siam and British short? Probably, it doesn’t seem to work. This is because there are too few materials, and we can see that these two pictures can be extracted from each other with too few short features. What if we Siam short put 100 picture, the short put 100 picture for your reference, and give a Siamese or English is just a photo can be identified is that a cat, if not recognized, also has a 90% can guess may be right. So if you provide 500 pictures of Siamese 500, are you more likely to guess right?
How do we identify Siamese and British short? It is first summarized the characteristics of the two cats such as facial color, eye color, etc., when have a picture to identify short, we will see if facial color, eye color can be characteristic of Siam.
Will computers be able to identify the two cats as well, after learning how to identify Siamese and English short?
So how do computers recognize images? Let’s look at how computers store images.

The image in the computer is a pile of Numbers in order, 1 to 255, which is a black and white picture, but the color varies from three primary colors – red, green and blue.
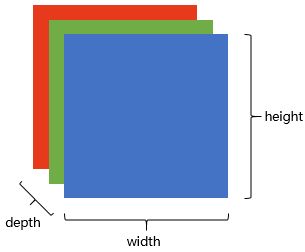

In this way, a picture is a cuboid in a computer! A cuboid with a depth of 3. Each layer is a number between 1 and 255.
To get a computer to recognize a picture, you have to let the computer know that it wants to recognize the features of the short image. Extracting features from images is the main task of identifying images.
Here is the main character, roll and neural network.(Convolutional Neural Network, CNN).
The simplest convolutional neural network looks like this.
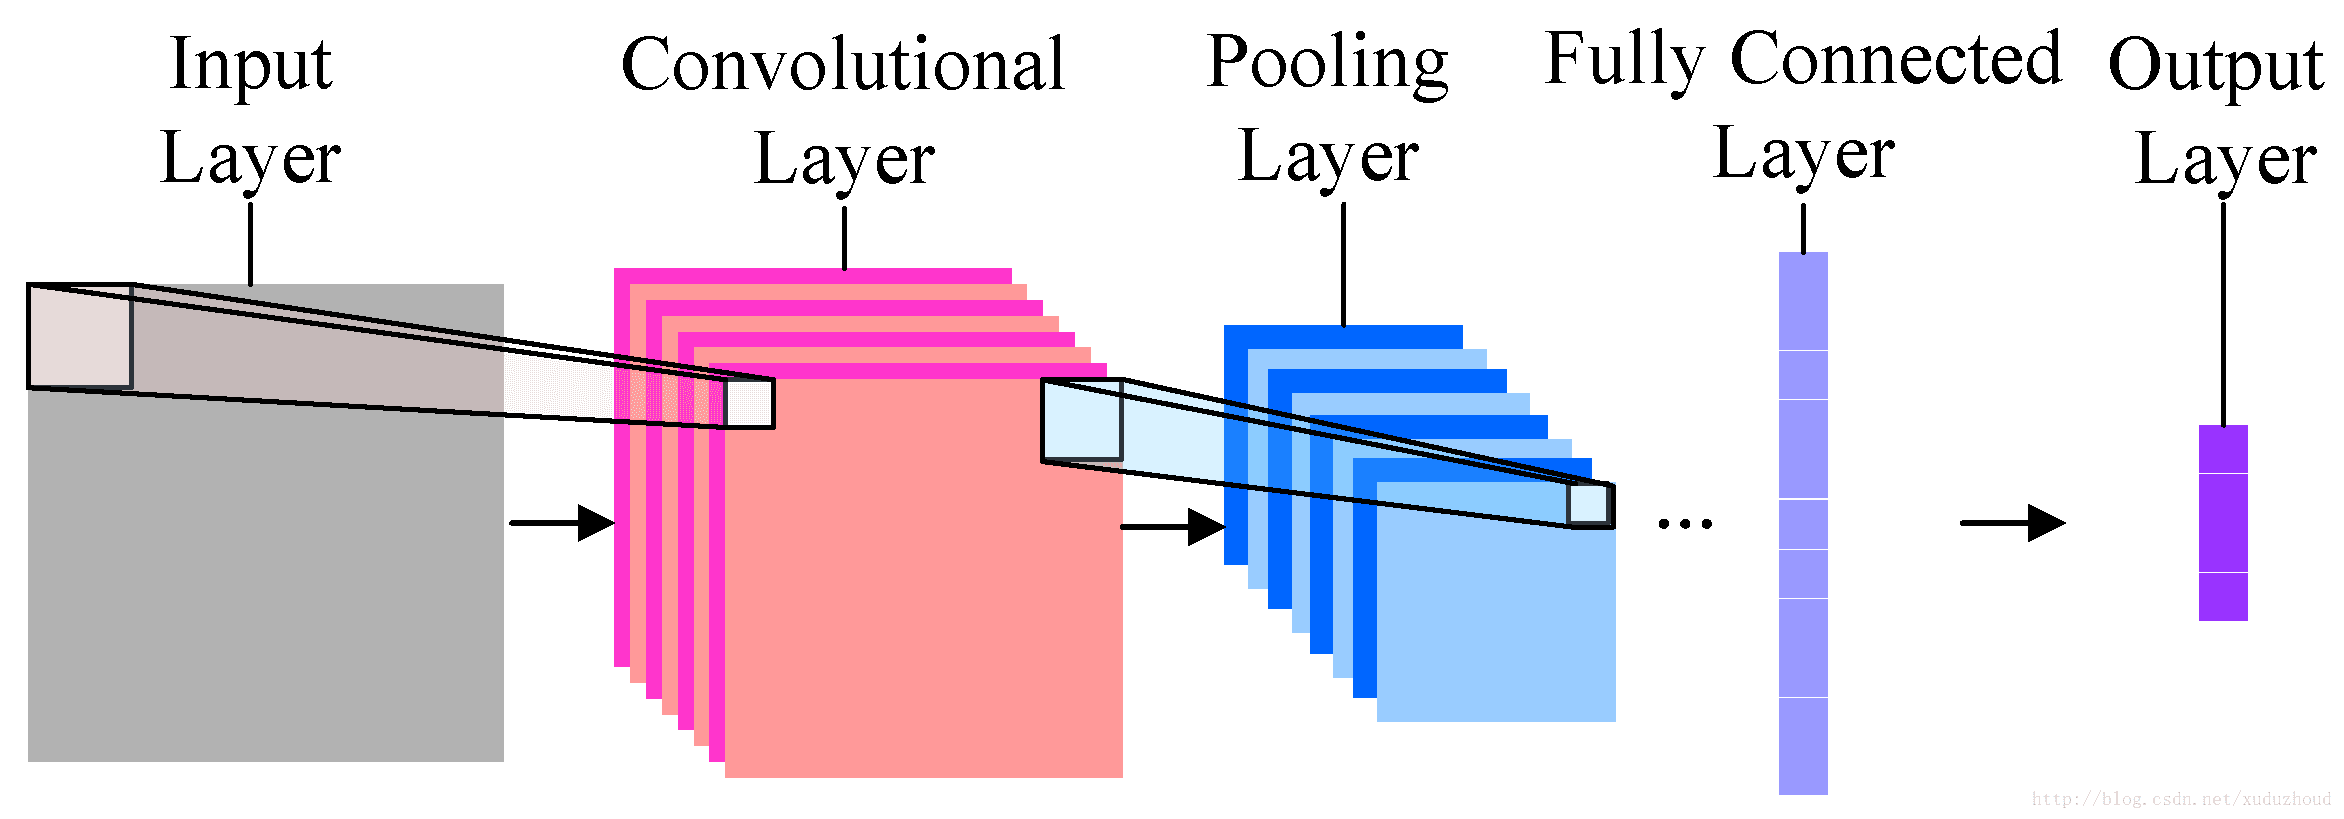
It is divided into input, convolution layer, pooling layer (sampling layer), full connection and output. Each layer compresses the most important identifying information and transmits it to the next layer.
Convolution layer: to help extract features, the deeper (multi-layer) convolutional neural network will extract more specific features, and the more shallow network extraction will be more obvious.
Pooling layer: reduces image resolution and reduces feature mapping.
Full connection: flattening the image feature, treating the image as an array, and using the pixel value as the characteristic of the value in the predicted image.
Convolution layer
The convolution layer extracts the features from the picture, and the image is stored in the computer according to the format we mentioned above (cuboid). First, extract the feature and how to extract it? Use the convolution kernel (weight). Do the following short operation:
You look at the left and right matrices, and the matrix sizes are from 6×6 to 4×4, but the size distribution of the Numbers seems to be consistent. Look at the real picture:

The picture seems to be blurry, but what about the size of the two pictures? It’s in the following way: same padding.
You add a circle of 0 around the matrix of 6×6, and then you have a 6×6 matrix, and why you add a circle of 0 is related to the size of the convolution kernel, the step length and the boundary. Do it yourself.
The above is a demonstration of using a 3X3 matrix on a 6×6 matrix. What does it look like to convolve in a real picture? The diagram below:
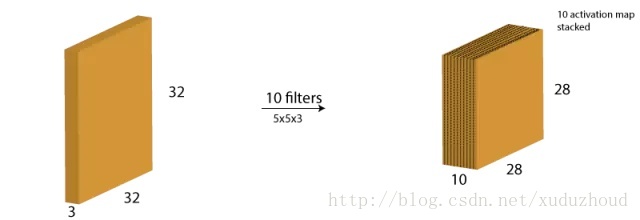
A 28x28x10 activation map (activation diagram is the output of the convolutional layer) is obtained by convolution of a 32x32x3 graph with 10 5x5x3 filters.
Pooling layer
Reduce image resolution and reduce feature mapping. How do you reduce it?
Pooling is done alone on each depth dimension, so the depth of the image remains the same. The most common form of the pooling layer is the maximum pooling.
You can see that the image is obviously getting smaller. As shown in figure:
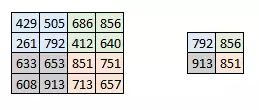
A new graph is obtained by extracting the maximum value of 2×2 on the two-dimensional matrix of each layer of the activation graph. The real effect is as follows:

With the increase of convolution layer and pooling layer, the characteristics of corresponding filter detection are more complicated. As you accumulate, you can detect more and more complex features. There is also a problem of convolution kernel optimization, and multiple training to optimize the convolution kernel.
The following USES apple’s convoluted neural network framework, TuriCreate, to distinguish Siamese and English short. (first of all, I have been working late in win10 to reload the computer more than 3 times. The system should have WLS, and it is convenient to install turicreae under the enterprise version, MAC system and ubuntu system.)
First of all, prepare to train with 50 pictures of Siam, 50 long. The test USES 10 pictures.
Code :(development tool anaconda, python 2.7)


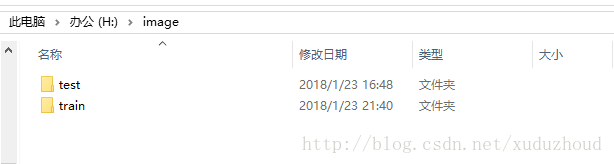
The data is placed in the image directory of the h disk, and I am installing ubuntu in win10, so the h disk is hung in MNT/down.
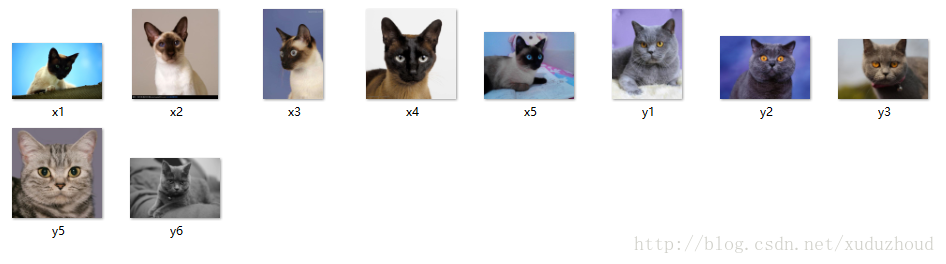
Test files :(x refers to Siam, y refers to short, so the name is to distinguish the cat type from the test pictures in the code)
test_data[‘label’] = test_data[‘path’].apply(lambda path: ‘xianluo’ if ‘x’ in path else ‘yingduan’)
The first results are as follows:
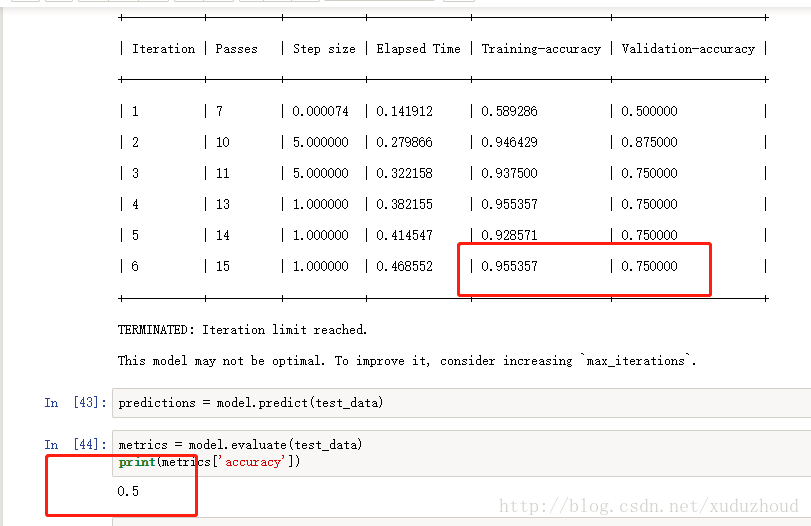
The accuracy of the training accuracy is 0.75 and the accuracy is 0.5. Well, it seems that the study is too little, and it will take three years to simulate the five years of the college entrance exam, which will increase the number of Siam and English short pictures to 100. I’m looking at the results.
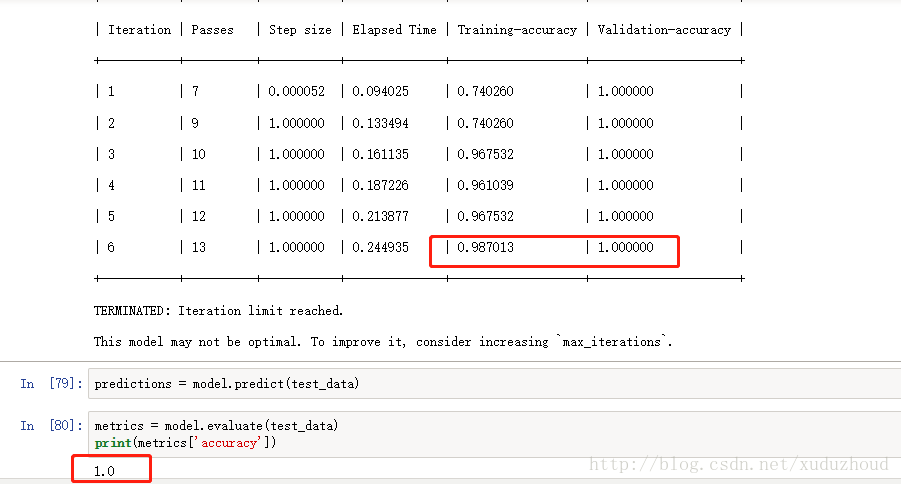
The accuracy of the training was 0.987, the accuracy of the test was 1.0, and the accuracy was 1.0.
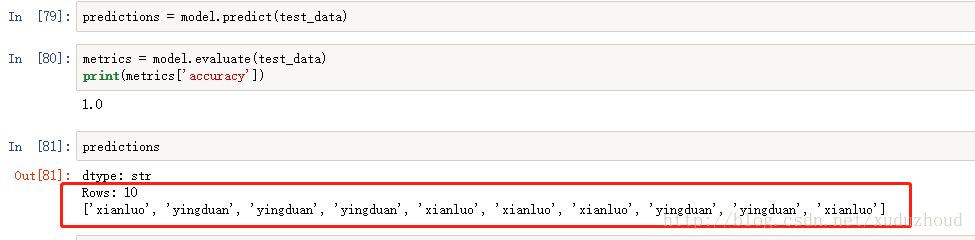
See the results of turicreate recognition:
Our actual picture of the cat is :(red is the type of the real cat – in the code, according to the image name, green is the type of cat identified)
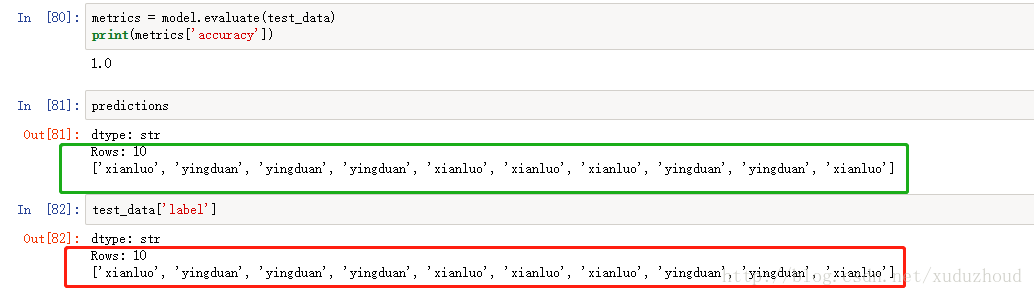
You can see that the two are consistent. The cow forces the training data only 200 pictures, can achieve this effect.
Python USES Deep Neural Networks to Identify Siamese and British Short.,首發(fā)于Cobub。
]]>據(jù)驅(qū)動(dòng)運(yùn)營(yíng).png)
What is content operation?
Content operation refers to a series of marketing activities related to content based on product content planning, content creation and editing, content optimization and publishing. For different channels, content operation has new media content operation (such as WeChat's content operation), content platform operation (for example, the content operation of Jane's book), etc. According to different business, content operation can be divided into promotion content operation, product content operation, user content operation, etc.
Is the Data Analysis Absent in Your Content Operation Strategy?,首發(fā)于Cobub。
]]>
What is content operation?
Content operation refers to a series of marketing activities related to content based on product content planning, content creation and editing, content optimization and publishing. For different channels, content operation has new media content operation (such as WeChat’s content operation), content platform operation (for example, the content operation of Jane’s book), etc. According to different business, content operation can be divided into promotion content operation, product content operation, user content operation, etc.
The importance of content operations.
Content operation occupies a very important position in the whole operation activity. First of all, the content can establish the connection between users and products. The content can convey the brand value while also cultivating the user’s cognition of the product. Secondly, content operation is also a part of product service. Users can not only consume content directly, but also help users to consume products. In a word, good content operation is very helpful for users to pull new, retain and transform users.
The steps of content operation.
Using data-driven content to run content is an essential skill for marketers. Before creating content, we can use data analysis to identify the target users and set the right goals (for example, how many new users will we bring after our content is released?). And to a certain extent the impact that the content is about to have. To use data-driven content, we must master these three steps:
Data collection, data analysis, data feedback.
1. Data acquisition: understand target users and competitors.
The difficulty with data-driven content operations is that we must understand our target users accurately. Only by accurately understanding the target users can we output the content that is close to the user’s needs and arouse the resonance of users.
In order to understand users, we need to collect as much user information as possible, including users’ online and offline behaviors. For example, a user in the online search what questions, which topic is active in social media, like click what content and so on these online behavior are we to understand the need to collect information. User behavior data acquisition is to let us understand the user’s interest and interests, and the common behavioral characteristics of users. After that, we can group users according to their common interests and behaviors, and produce targeted content for different user groups.
In addition to collecting user behavior data, we also collect behavioral data from competitors, for example, what they developed. In what channel to promote; How many new users, how many transformations, and so on. Through understanding the performance of competitors, we can speculate about what keywords or subject to users more attention, the user has no interest in what content and to attempt to innovation, find the breakthrough point, to create some fresh content to win the user’s heart.
The purpose of data collection is to better understand target users and competitors. We can use these data to think about how to add value to our brand, how to produce differentiated content to attract users.
2. Data analysis: identify the most effective content promotion channels.
By collecting user behavior data and competitor’s behavioral data, we have a very deep understanding of when and where the target users are and what they want.
After we have produced targeted content, then it is how to promote it through the most effective and influential channels. In a blog to share is far from enough, no matter how much we output the contents of the user requirements, if the user had never seen these content, then we are purely a waste of time and energy.
There are many channels for promotion, such as email push, paid-for display advertising, big V cooperation with large impact on target users, or simple repeat marketing. Regardless of the promotion channel, we need to analyze target user behavior data and competitor behavior data to determine.
Data analysis can prevent us from promoting blindly. We can find out the best distribution channels for user feedback by analyzing the different performance of different content distribution channels.
3. Data feedback: prove the value of content.
After content output and promotion, we evaluate the content of our output and prove the value of our efforts.
How does the user interact with our content? Does our content cause a lot of discussion? What actions do users have after they have access to our content? · such analysis can give us a clear understanding of the value of content.
It is difficult for some brands to set the return on content investment, but we can describe the impact of content through proxy indicators. We can use different scoring systems to evaluate the participation of different stages and compare the effects of different content modules. For example, click browse content 1, and further participate in thumb up 2, collect content 3, share content 4, and then evaluate the purchasing habits of different scoring levels. Ultimately, we can figure out the relationship between these scoring data and sales data. The higher the sales, the greater the value of the content we produce.
Summary
The success of content marketing is no accident. The key to the success of content operations is the ability of operators to properly manage and use data output to be beautiful and to guide participation and transformation.
Is the Data Analysis Absent in Your Content Operation Strategy?,首發(fā)于Cobub。
]]>
Outline:
? What is user churn?
? Reducing user loss is a top priority for businesses.
? Ten strategies for reducing user churn.
How to Improve the User Churn Rate ? Here are 10 Strategies.,首發(fā)于Cobub。
]]>Outline:
? What is user churn?
? Reducing user loss is a top priority for businesses.
? Ten strategies for reducing user churn.
Many companies do not have specific plans to activate silent users and recall lost users. Some companies try to replace lost users with new users, while others spend a lot of time analyzing problems and trying to prevent users from losing them.
Before we discuss the methodology for reducing user churn, we need to understand how user churn is defined.
What is user churn?
User churnrefers to the number of users who leave the product within a specified period of time. According to different products and different businesses, the time period is different. The user loss indicator shows the ability of the product to retain users from the side. Companies will pay a heavy price for the loss of their users.
Data talks
When it comes to the impact of user churn, research has done the statistics, and the cost of getting new users is five times the cost of retaining existing ones. The harvard business school report also points out that a 5 percent increase in retention rates can lead to a 25 to 95 percent increase in profit. There are also data suggesting that retained users are major contributors to corporate revenue.

According to gartner, a consultancy, 20% of retained users will contribute 80% of the company’s future revenues. At the same time, the chances of successful sales to the remaining users are 60-70%, and the chances of successful sales to new users are only 5-20%.

The above data shows that reducing user loss and improving retention of users is the most important and beneficial to enterprises (especially e-commerce enterprises).
What are the adverse effects of user loss on the enterprise?
? Reduce enterprise income, affect enterprise performance.
? Lower corporate profitability.
? Improve enterprise marketing and user recall costs.
There are 10 strategies for reducing user churn.
1. Analyze the reasons for user loss.
Why do users lose? The answer also needs to be found in the user, the most direct way is to talk with the user. Phone calls are the quickest way to talk to users. By telephone, we can know that our products do not solve the users’ pain points, what problems we have caused to users and so on. In addition to phone calls, we can also find out the reasons for the loss of users by sending emails to users, inviting users to comment on the website, or interacting with users on social media.
2. Maintain user engagement.
Maintaining user engagement can help prevent user loss to some extent. In order to maintain user engagement, we need to continue to prove the value of the product to the user. In addition to letting users know the main functions of the product and updating the content of the iteration, we can also show users new transaction information, special offers or recent preferential activities, etc.
Previous face-to-face interactions have been the main way for users to participate, but new research shows that websites and social media are becoming the main ways for users to participate.

Getting new users involved in the product is also a good way to reduce user churn. For example, we can ask new users about the first impression of the product, which helps us understand the initial impact of the product.
3.Give users adequate guidance.
Reducing user churn can be achieved by providing users with high-quality guidance/support information. These guidelines include but are not limited to free training, online BBS, video guidelines or product demonstrations. Good product functionality with enough guidance not only gives users the tools to solve problems, but also gives users a guide to the tools they use. The greatest potential of our products and services is to let users feel that we are paying enough attention to them and that it is not so easy for users to leave their products.
4. Timely detection of users on the edge of loss.
Data from the past loss of user behavior through the analysis, we can come to the conclusion that some loss of user joint behavior, such as they lost before that time is not as active as ever, loss and puts forward some problems to us before but didn’t get our feedback and so on. By identifying these common features, we can predict users who are on the edge of loss and take appropriate measures to retain them.
5. Identify high-value users.
Identifying high-value users and prioritizing the needs of these users is important because our revenue is primarily contributed by these high-value users. There are two ways to identify high-value users: one is to analyze the engagement of users in each stage of the product life cycle, and the other is to group users according to user behavior. We can have a high degree of engagement at each stage of the product life cycle, and the user group that often implements the purchase behavior is considered a high-value user group.
When analyzing user engagement and the behavior of different user groups, we can not only identify high-value users, but also identify users who are on the edge of loss. In other words, we can also predict the loss of users as we determine the high value users.
6. Incentive
There are many ways to motivate users, such as preferential activities, points exchange, etc. In incentives to retain on the verge of losing users or recall has been lost, we must ensure that these measures cost consumed less than these users to our contribution to profits. We can’t afford to waste a lot of human resources to save those who won’t contribute a dime.
7. Target users.
In As A Product Manager, Do You Really Understand the Data Analysis?,We have a product vision – the product must be targeted. After all, the target user is barking up the wrong tree, even if we make the most of it and we can’t let the user stay. If we use words like “free” and “cheap” to attract new users, our new users may not be our target users at all. Those who collect freebies are the most likely to lose. Our target users should be users who value the long-term value of our products, not those who are greedy and cheap.
8. To provide better service to users.
Poor service can lead to loss of users. There are two main reasons for the loss of users: one is incompetent and rude staff, and the other is that the service is too slow to be tolerated. More than 70 percent of the lost users are lost to bad services.

The image above shows the importance of user service. Any service that makes users dissatisfied can lead to loss of users.
9. Value user complaints
The product problem exposed by user complaints is only the tip of the iceberg. According to the survey, 96% of users will not be satisfied even if they are dissatisfied with the product, and 91% of them will leave without a word. Only 4% of users will complain about the product!

Therefore, we must take users’ complaints and complaints seriously and give timely feedback. Research shows that users who receive feedback and solutions are more likely to become loyal users, who can spread our products or services to form a good reputation.
10. Show our competitive advantage.
We need to make it clear to the user that we are different from our competitors; Where we stand out; If users don’t use our products, they will miss something. Knowing these problems, we can see what our competitive advantage is. After knowing the competitive advantage, we can hype it up!
We’ve talked about 10 strategies to reduce user loss, and we want to help the people who run the APP.
How to Improve the User Churn Rate ? Here are 10 Strategies.,首發(fā)于Cobub。
]]>
對(duì)于大多數(shù)廣告主來說,廣告投放的目的無非就是吸引更多的用戶,提升廣告ROI,最終實(shí)現(xiàn)營(yíng)銷轉(zhuǎn)化。
Data Analysis: How to Optimize Advertising ROI?,首發(fā)于Cobub。
]]>For most advertisers, the purpose of advertising is to attract more users, improve the ROI, and finally realize the marketing transformation. But they also pay more attention to the information, such as:
Is the advertisement on time?
Is the media/advertising company committed to achieving this?
Is the data produced by the media/advertising company real?
Did the media cheat?
Whether the investment in advertising is proportional to the output… And so on.
Why should advertisers care? Here is an example of the cost of the laptop in ZOL:

From above, it is not difficult to see, for advertisers advertising expenses are a lot of spending, each advertising need to invest a lot of money, who all want to each cost spent. To understand the above questions, you should know the meaning of the various data indicators in the advertisement, so as not to be deceived by the false information.
The mystery behind the advertising figures.
There are a lot of indicators of advertising effectiveness. Each monitoring index reflects different data effects, such as the rate of jump and arrival rate, and whether the response advertising effect has reached the media’s promise. The amount of exposure, the amount of clicks reflected CPC and CPM are not enough, and the regional distribution of advertising audiences is not correct.

And the dimensions of the dimensions that are released are different. For example, the purpose of promoting brand is to focus on the number of clicks, the number of clicks, the number of clicks, and the number of users to reach the number of users; Focus on the arrival quantity, the number of users, the number of two jumps and the total number of views. To guide the user to participate in the activity to focus on the conversion and conversion of users; To promote sales for the purpose of focusing on conversion details.
Compared with the media data, advertisers pay more attention to the advertising effect.
The data indicators reflect the results of the release, but in the actual operation, in the face of various advertisements, which location, which media is the best? How to measure advertising effectiveness? Which ads are effective? What media combinations are really effective… .. ? This series of problems is also the focus of advertisers.
So how to solve these problems in advertising and achieve accurate delivery? This needs to optimize advertisement release, the problem that appears in advertisement release is solved in time.
I. Understand the basic methods of evaluating advertising effectiveness.
Advertising effectiveness evaluation generally around hits (exposure), reach the quantity, second jump, into four indicators to assess the amount of, each indicator to measure the advertising data of different stages, through these data to help us analysis of the problems existing in advertising. So we use a funnel to show you:

One of the things we want to focus on is that the amount of click here is more important than the amount of exposure. Because measuring the effect of advertising is to measure “the target audience of contact advertising”, it is not accurate to use the exposure code. This is because:
1. The number of exposure codes is not equal to the amount of advertising exposure (the actual number of advertisements displayed)
2. The amount of advertising exposure is not equal to the number of people who see the advertisement (the Internet advertising form varies widely, the same exposure amount of advertisements, the number of people who really notice/see may be huge)
3. The person who sees the advertisement is not the target audience of the brand.
There are three levels of difference, so it is not accurate to use exposure to measure the “target audience”. Click the quantity to reflect the real effect, the exposure amount for reference.
II.Understanding transformation.
Advertising is inseparable from the media resources. Through the website, we need to know this information:
Which areas bring more registered users, which search engines bring more orders, which advertising channel has the highest conversion rate, which landing page brings the highest conversion rate and so on.

By mastering these transformation information, we can help us analyze and transform the situation, such as:
? The transformation of the external source website can directly reflect the quality of the website’s netizens, while combining the external source traffic to reflect the conversion rate effect of each source.
? The transformation details can be used to analyze the effect of each specific transformation, as an evaluation basis for the CPS effect.
III.Understand traffic.
The most important thing is to have traffic. Where does the traffic come from? Which channels bring more users, and which areas bring more… .. Through the analysis of traffic source, help us to optimize the adjustment of advertising channels and advertising programs. Such as:
1. According to the external inbound traffic inflow and the second jump rate ranking, brush selected high-quality sources, and eliminate the bad sources.
2. According to the traffic curve of the website, learn the habits of Internet users and choose the best advertising content.
3. According to the changes in the traffic period of the website, find the laws and abnormal points of the flow, and then find out the deep causes, find the problems in time, and adjust the delivery.

IV. Distinguish the quality of traffic.
In the process of advertising, often meet the false traffic, the phenomenon such as malicious click, so the quality of the evaluation flow has four elements: malicious click, false and landing page content access flow, good flow user activity. At the same time, false and low quality flow has the following characteristics:
? The flow data of 24 hours is very uniform, without obvious characteristics.
? The flow chart in the sky is high and low, and the fluctuation is very intense.
? Click, arrival, and jump rates are very similar across the country.
? The landing page is rarely clicked and almost nothing gets noticed.
? The visitor’s browsing depth is close to 1.
In a word, good advertising optimize ultimate purpose is to improve advertising ROI, actually in the final analysis in a word, spent it is to make every cent advertising work, so how to make every advertising works, is make every AD measurable, let each AD last effect can be precise Numbers to show, so that accuracy is higher, just also can maximize advertising value.
Data Analysis: How to Optimize Advertising ROI?,首發(fā)于Cobub。
]]>網(wǎng)金融活動(dòng)運(yùn)營(yíng)1.jpg)
2017 China Internet Finance Annual Report points out that the overall level of Internet financial risk is declining, and the risk cases are initially contained.But the future is still very difficult to purify the Internet financial market, so the government regulation of the following countries will inevitably continue to increase, and the cost will be higher. On the other hand, the development environment of the industry has been gradually cleaned up with the improvement of the fittest of the industry.
We have also seen in 2017, a development of the Internet financial status: insurance development growth is slowing, stabilise financial management module, stock has dropped sharply in the whole accounts, the boom of equity financing, and consumer finance and pay two pieces of business development situation is very optimistic, so how to grab more market?
We see agencies that are doing everything in their power to produce all kinds of play. 2015 thus was born the first Internet financial services section, may say that this is the Internet finance double 11, most of the 11-member cartel, is also the largest, China feedback strength strongest online financial event.
Internet financial products cover many aspects: payment, loan, finance, credit card, insurance, etc. Today I mainly share with you about the operation of Internet wealth management products based on the life cycle, and I hope to give you some ideas of operation.
5000 Word Essence, Teaching You to Build the Internet Financial Activities Operating Knowledge System,首發(fā)于Cobub。
]]>2017 China Internet Finance Annual Report points out that the overall level of Internet financial risk is declining, and the risk cases are initially contained.But the future is still very difficult to purify the Internet financial market, so the government regulation of the following countries will inevitably continue to increase, and the cost will be higher. On the other hand, the development environment of the industry has been gradually cleaned up with the improvement of the fittest of the industry.
We have also seen in 2017, a development of the Internet financial status: insurance development growth is slowing, stabilise financial management module, stock has dropped sharply in the whole accounts, the boom of equity financing, and consumer finance and pay two pieces of business development situation is very optimistic, so how to grab more market?
We see agencies that are doing everything in their power to produce all kinds of play. 2015 thus was born the first Internet financial services section, may say that this is the Internet finance double 11, most of the 11-member cartel, is also the largest, China feedback strength strongest online financial event.
Internet financial products cover many aspects: payment, loan, finance, credit card, insurance, etc. Today I mainly share with you about the operation of Internet wealth management products based on the life cycle, and I hope to give you some ideas of operation.
Let’s take a look at financial user portraits:
According to the 2017 China Internet finance annual analysis report, the majority of wealth management users are 26-35 years old, accounting for 56% of the total. More men than women, like loan users, have the highest proportion of educated people; They have a certain financial sense of 80, the first-tier city netizens are not high, but the penetration rate is highest; The number of Internet users in line 3 is high, the permeability is not enough, there is still a large market space.
網(wǎng)金融活動(dòng)運(yùn)營(yíng)2.png)
The growth of mobile wealth management enterprises is slowing down, and the industry is transformed from savage growth to rational development. The market is gradually slowing down. However, users’ preference for short-term products declined and the overall investment duration was extended, indicating that the maturity of wealth management users gradually increased.
The key of operation is to make the scene differentiation, the financial community and the interactive interest. For example, we can set up some scenes that can touch the high educational background to attract the users, such as the overseas credit card case of the previous time in the friend circle refresh. Let’s take a look at the product form of wealth management products.
I. financial product form analysis
According to the financial product cycle division
According to the financial product cycle, it is divided into: short-term + long-term, current and regular.
due on demand
The current product is less, relative to the interest will be much lower, such users may money flexible excessively high enough, or is the financial management is not particularly understand, through a combination of financial knowledge such as the user can cultivate high paying customers or direction for a long period of time, usually is to provide learning content, complete the study can obtain higher interest rates to reward.
Week inreasement:
Regular withdrawal per week, at the same time enjoy a return, if not removed, the longer the higher interest rates, such products cater to the higher requirements for capital flexibility of user groups, these groups usually for low-income people, usually set the bar too low, as low as 100 yuan, this kind of products covers a wider user groups, more flexible, the threshold is lower.
Month increasement:
Monthly withdrawal on a regular basis, at the same time enjoy a week week rose products higher yields, such products are suitable for commuters money, combined with the credit card 50 days grace period for marketing encourages users to made after financial profit at the same time, but frequent operation very troublesome, if can also automatically combined with the credit, reduce the user operation, improve the user experience, there will be a lot of users will choose near moonlight clan.
Quarter increasement:
Medium and short – term products, in the middle of flexibility, as well as the duration of the quarter, the rate of rate increase will also increase.
Deposit for one month:
A person who usually applies to a short-term fund surplus. Usually the money is already used or the money is to be withdrawn after a month or so, in a short-term attempt by some new users to consider the safety of the platform.
Deposit for 2 months:
Short-term wealth management products
Deposit for 3 months:
Short – term financial products
Deposit for 6 months:
Medium-term wealth management products
Deposit for 12 months:
Long-term wealth management products
Deposit for 24 months:
Ultra-long term wealth management products usually have fewer users
The product form of wealth management
Novices wealth management products:
Usually in order to attract new users, many platforms are taking new users into high interest rate policy to attract users, have sent gold, also have sent short-term high interest rates, usually during the activity will have the other new activities to cooperate.
VIP products:
Provide VIP product customization to high paying customers and enjoy higher financial privileges than regular users.
High cast surely:
Setting up a higher level of investment to encourage users to increase their investment compared with a higher yield over the same period.
The principle of setting interest rates basically:
VIP exclusive > high investment > normal casting
網(wǎng)金融活動(dòng)運(yùn)營(yíng)3.png)
A colleague’s financial zone:
Usually such cooperation, financial institutions and enterprises to give employees the yield of higher than ordinary employees, companies are usually cooperation larger enterprises (tencent, jingdong, alibaba, baidu, etc.), and complete certification need employees through E-mail.
Pay money:
Bind bank card, monthly pay day, automatic transfer money, convenient and quick.
Change money:
It is based on the WeChat scenario, with the change of money management, which captures the money of WeChat user’s change.
member points:
Set up financial user integral system, integral consumption system, such as: exchange activity participation qualifications, exchange rate coupon, exchange financial gold, VIP, cash prizes, membership system is the key to build integral mechanism and mechanism of consumption form a closed loop.
Ii. Analysis based on the operation of life cycle
Knowing the industry background and understanding the product form, we will then analyze the operation of each stage from the product life cycle meaning.
1. Acquisition
1)Invite prize:
In order to better improve the platform users, usually set to invite contests, for financial products, users tried a platform, there gradually developed a sense of trust, and invite friends incentives to stimulate the old users, the effect will be better than pure do promotion.
By inviting, both sides can obtain a certain reward, including cash reward, the rates voucher, finance, platform credits, physical prizes, etc., usually on the invitation, the number of pyramid incentive policy to encourage users to invite more users.
We need to inform the rules of the activity and the way of accepting the award, otherwise it will add to the burden of customer service. On the other hand, we can divide the reward level of the recommender by the amount of the position, form a second dimension incentive policy, pull up new colleagues, and improve the number of positions of old users.
In addition, the inviter page and to be inviter’s page is not the same, emphasis on the two sides can be rewarded, inviter page can be obtained by inviter stressed after registration on their own rewards, to encourage users to invite, usually on the invitation page because do a contacts list and invited friends benefits ranking, stimulate users.
網(wǎng)金融活動(dòng)運(yùn)營(yíng)4.png)
2)Registered grand prize:
This kind of activity mainly is direct contact with the C end users, generally through other channels to promote touch; The user finds the activity page independently and actively joins in.
The usual channels include information flow advertisement, soft language promotion, platform cooperation, technology website, offline advertisement, etc. The external material will be attractive enough, such as sending New Year’s red envelopes with WeChat, downloading registration, or adding a financial entrance to other platforms.
Every platform, hoping to provide more diversified services, such as medical users only when they are ill will use 160 platform, so in order to improve the user active, increase financial management module allows users to avoid losing customers because of the retained of funds; But if they develop a wealth management module themselves, they will raise the cost, so the best way is to find professional financial companies to work together and charge through CPC, CPM and CPA.
網(wǎng)金融活動(dòng)運(yùn)營(yíng)5.jpg)
2. Active
1)Free+Integral draw:
In order to enhance the platform’s activity, some games are usually designed, and the lottery is a method used in many industries, which can be used for free trial and integration exchange.
But in setting the odds, must consider the odds problem: if smoke frequently miss will hit the user enthusiasm, if the smoke will increase in the operating costs, so you need to focus on setting up probability model.
網(wǎng)金融活動(dòng)運(yùn)營(yíng)6.jpg)
2)gameplay:
In order to boost the platform’s activity, many industries will adopt a check-in mechanism, which is usually played with small games, signed and delivered points, or a coupon for interest rate hikes, money management, etc. But in order to improve the user’s activity in a row, we need to set some milestones in the game task incentives, such as continuous check-in week award, doubled, or have the opportunity to enjoy a special gift, stunt to attract enough user participation.
In this kind of play, it is necessary to build fine data model.
First categorizing people can, user activity, the loss from the dimension of position analysis, completes the dimension after analysis in the content of the need for each type of people do fine operation and data model is recommended. For example, in setting up interest rate coupons, we can increase the number of customers by raising interest rates for non-holders.
In addition to the salary and wealth management users, the appropriate content guidance can be used to improve the position conversion of such users.
Such activity pages can be chosen for their own development, or they can choose to intervene in other people’s activities. But get involved in other people’s activity compatibility poor, suggest oneself development.
Generally, the investment of game development is large and the user participation is higher, which can improve the platform activity very well. However, transaction conversion rate is not high, so it is necessary to evaluate the target of operation.
網(wǎng)金融活動(dòng)運(yùn)營(yíng)7.png)
3)Other creative methods:
In combination with the active and popular activities, the product packaging can attract users to participate and learn about the benefits.
If the appearance level of hongbao, by combining the image processing technology, the appearance of the picture is graded and the corresponding reward is given. Or by combining the public welfare for packaging to attract more social concerns, such as the public welfare drawing of tencent’s public welfare, often such a play is so interesting that audiences are willing to participate and retweet.
網(wǎng)金融活動(dòng)運(yùn)營(yíng)8.png)
4)Integral mechanism:
Establish the gold coin integral mechanism, can combine the product function, the task and the game reward obtain integral.
網(wǎng)金融活動(dòng)運(yùn)營(yíng)9.png)
5)Integral convertibility mechanism:
By playing games or conversing for goods, it is best to divide the prizes according to the user’s grade.
網(wǎng)金融活動(dòng)運(yùn)營(yíng)10.png)
6)Membership strategy:
The mature user operation strategy is usually based on the building of a healthy user membership system, so that users can enjoy different rights and interests under this system, thus stimulating the user to develop in a high quality direction.
Usually in member division mainly from the open amount is the number of hierarchies, hierarchical privileges, you need to the company’s business category + user personalization benefits combining (such as the member privileges, birthday gift bag, upgrade gift bag, Thanksgiving gift bag, private service), in line with the pyramid principle, the higher the rank, the greater the rights and interests.
網(wǎng)金融活動(dòng)運(yùn)營(yíng)11.png)
7)Intelligent AI technology play:
Combined with AI big data play, insight into user portraits, intelligent recommendation of wealth management products.
網(wǎng)金融活動(dòng)運(yùn)營(yíng)12.png)
8)Prize for finding bugs:
To better optimize products, users can be encouraged to optimize products through policies such as red packets or membership grade.
Such activities focus on the initial product teams with large user groups and financial input, in order to quickly optimize the user experience and initiate a nationwide search for bug activities.
9)UGC community content production:
In order to encourage the UGC essence content production, set the author hierarchy: senior elementary, intermediate, set up corresponding essence article level of reward system, completes the KOL operation and maintenance, to ensure that the content of output at the same time improving the quality of the article.
10)APP store Version update and comment:
It encourages users to download the latest version of the software and submit it to good reviews for better application rankings.
3. Retention
When it comes to retention, maybe we don’t see a lot of activities that are specifically focused on retention, but the fact that it’s preserved is throughout the operation.
The core of wealth management products is security, high yield, liquidity and satisfaction.
A previous article also said that the life cycle of a product is usually divided into one
Introduction, growth, maturity, decline
four stages.To improve the retention rate of the product, you need to analyze which life cycle the product is in.
What we usually see is the data representation of a certain time node of the platform, but we need to split the user data, usually the result
Data = total number of users + current number of new users – loss of users
.So to improve the retention rate of the user, we need to focus on pulling new and preventing user churn and doing the backflow.
網(wǎng)金融活動(dòng)運(yùn)營(yíng)13.jpg)
Acquisition aspect:
We need to focus on the quality of users, try to find accurate users, avoid introducing too many non-audience groups, leading to excessive turnover.
Prevent user loss:
We need to do a good job of analyzing the user’s loss, paying attention to the data performance of the next day of user retention, 7 days of retention, and 15 days of retention, and find out how the retention rate of new user is plummeting and analyze it thoroughly. We can from the time dimension, the user operation path dimension to the analysis, a functional analysis is because the product lead to loss of users, such as in the setting of game levels, if the user in a to gate pass special low, will hit the users, leading to loss of users, we need to do is to find these factors and optimize the product.
On the reflux:
Usually we need to analyze: what users are missing? Why is it lost? What are the means of reflux? How to keep users? And how to predict the user’s rapid loss prevention. After finding the lost user, the user can be divided to find the value points that attract each class of users, and to reach this wave of users through effective channels to guide the backflow.
In general, be good at user insight and analysis.
As operation we need to do intelligent dynamic operation, reduce operation of tedious work at the same time, more intelligent words must give users of each life cycle, each picture provide exclusive service users, the premise is to know what circumstances the consumption of user scenarios, and can perceive the change of the user in real time.
4.revenue
1)Limited interest rate hikes:
By introducing a limited number of hot style products on a daily basis, it has triggered a rush of users and boosted revenues and a platform.
網(wǎng)金融活動(dòng)運(yùn)營(yíng)14.png)
2)Long – term products with sales:
Through the short and long tie-in sale, by increasing the yield of short-term financial products, the highest yield of 36%, and as a stunt to attract more users investment, usually early can get good effect; But any activity will be long and the user will be boring.
At the same time, the disadvantage of this kind of activity is that the company’s investment is larger and the cost of investment is strictly controlled.
網(wǎng)金融活動(dòng)運(yùn)營(yíng)15.png)
3)Value management gold/interest rate coupon + bonus:
During the activity period, the user can obtain the corresponding treasure box for the specified product with a single investment, and the additional cash bonus can be obtained.
The following activities can be used to divide up 200 million yuan of financial funds, which can be obtained by cash incentives to stimulate users to invest more.
網(wǎng)金融活動(dòng)運(yùn)營(yíng)16-1.jpg)
4)紅包雨:
Play combined with New Year red envelopes rain, will be the company’s products packaged into activity prizes (rate increase ticket + financial gold + double card, etc.), cash for big red packets to brush red rain stunt to attract user participation, promotion activity, promote transformation.
網(wǎng)金融活動(dòng)運(yùn)營(yíng)17-1.jpg)
5. viral marketing
1)Gimmick enough, new and strange:
By planning some new and strange events, the public attention and dissemination.
For example, a hundred million money contest, in the form of live broadcast, caused a crowd of onlookers to watch, from the early planning, to the on-site police protection; To the American women’s network red live, the user money contest, made the public attention.
網(wǎng)金融活動(dòng)運(yùn)營(yíng)18.jpg)
Third, summary
This article combines the Internet financial industry trends and game analysis based on the life cycle of financial management products, combed the conventional some operating instructions of the systemic, designed to allow you to run it from the Angle to look at activities.
Basic operation to advanced operation is a process from point to surface growth, advanced operation to senior operation is a process from surface to probing, when we gradually cultivate their holistic view, any run into the problem, we can be found in the global knowledge network is most suitable for him to break point.
A few key points are summarized:
? Understand industry trends:
Cultivate forward-looking, early detection of new opportunities;
? Familiar with strategic objectives:
Understanding the positioning of the brand, combining with its own advantages and capabilities, find the business direction that will improve the performance as soon as possible.
? Be familiar with product business model:
Clarify the possible realizable mode and maximize the performance;
? Global planning capability:
From the global, the best breakthrough method for each point is found respectively.
One last word from a famous economist:
Any social problem arises from economic inequality.
For Internet financial platform, solve social demand to the development of better, pratt &whitney finance is within the scope of the affordable cost, demand for financial services of all social strata and groups to provide appropriate and effective financial services, small businesses, farmers, urban low-income people and other vulnerable groups is its focus on the service object; The future of the Internet financial entering pratt &whitney financial period of rapid development, by combining large data insight, provide dynamic operating strategy, more accurate service for small and medium-sized trace, better realize the integration of online, build a more harmonious society.
5000 Word Essence, Teaching You to Build the Internet Financial Activities Operating Knowledge System,首發(fā)于Cobub。
]]>But running children's shoes is mostly data small white, without programming and technical foundation, how should we analyze and use good data? Today, starting from the common data problem, I hope that you can quickly get the data analysis to make the data better for the work service, and don't waste the data's value.
To Marketers: How Do You Not Rely on Analysts to Do Your Own Data Analysis?,首發(fā)于Cobub。
]]>But running children’s shoes is mostly data small white, without programming and technical foundation, how should we analyze and use good data? Today, starting from the common data problem, I hope that you can quickly get the data analysis to make the data better for the work service, and don’t waste the data’s value.
What data should I analyze? From what Angle?
This is the biggest headache for marketers, not knowing which data to focus on, analyzing what data to analyze, and not knowing exactly where to analyze the data. Some common data indicators are compiled for the friends, and some applicable analysis angles are summarized
1 Common data indicators of Internet operation concern
? Traffic
1)visit:PV、UV、IP(commonest);Jump rate, average length of visit, average access to pages, etc. Use devices, operating systems, browsers, geographical distribution, and other access behavior;
2)register:Registration number, registration trend, accumulative registration number, achievement rate, etc.;
3)Channel & promotion:Source channel distribution, total consumption, display quantity, click rate, click rate, average click price, conversion rate, conversion cost, ROI, etc.
? User
1)Active/login:DAU、WAU、MAU、Active rate, login, etc;
2)Retention:The retention rate, the retention rate of the week, the retention rate of the month and the retention rate were also analyzed.
3)Loss: loss of data is easy to forget, including loss rate, loss, average daily turnover, etc.
4)Pay: the number of paid, the conversion rate, the average amount of the order, etc., more of the order data;
5)Other: daily number of comments, number of people, share and so on
6)Profile picture: on one hand, analyze user attributes: focus on age, gender, education, occupation, region, marital status, income, interest, etc. On the other hand, analyze user behavior: login frequency, activity rate, cumulative consumption amount, recent purchase, purchase times, repurchase rate, etc.
? order: The number of people paid and the number of new subscribers; Total amount, daily order number, average daily turnover, customer unit price; Paid amount, paid gross profit, paid profit, repurchase rate, ARPU, paid each route conversion, etc.;
? content: PV、UV;UGC, PGC,Number of articles, number of followers, number of reading, number of interactive (comments, thumb up, etc.), transmission number (forward, sharing, etc.);
? activity:active pagePV,UV,New number, participation number, the number of login, transformation, transformation to clinch a deal amount, ARPU, the number of coupons issued/using, marketing costs, conversion rate, the number of ROI, sharing, sharing number, etc., the data will depend on the activity type;
? service:E-commerce, O2O and other industries are easy to deal with, including the number of consultants, the conversion rate, the return rate, the refund rate, the rating, the rating, the rate of complaints, etc.
? APP:The number of downloads, number of activations, the number of new registrations and the cost of customers. Number of starts, number of starts and length of stay; Push arrival rate, opening rate, etc. Other reference data.
2. Applicable analysis Angle and method
Data analysis has all kinds of lofty principles of analysis, such as AARRR model, 5W2H, etc., but operation is not a professional data analyst, it is enough to be able to use these principles
? comparison:It is divided into horizontal and vertical comparisons, such as vertical and sequential analysis, horizontal and different products, and different channels.
? Movement (change):The index varies with time, which is the growth rate (compared with the previous year and the previous month).
? distribution:This is a good understanding, such as the classification of different ages of users, distribution of different occupations, different geographical distribution, etc.
? subdivision:From the multi-level to understand the data, such as the analysis of the specific order data of different cities in different provinces in the country, from the country to the provinces – the city of the drill down in-depth analysis;
? transform:It is mainly reflected in the final transformation of the results and the transformation of each path, such as the transformation analysis of the whole registration process to optimize the details.
? prediction:Based on the current situation, the index value of the next analysis period is estimated.
Case
A fruit O2O platform to confirm the number of each category should be prepared within a week, if no data support, and that only by artificial experience combined with a general conclusion, average error is larger in fruit waste more. How do you solve this problem? When there is the usual data, data trends, have certain rules can be obtained through the data to predict a more reasonable and more accurate numerical, and an optimal scheme is obtained by continuous prediction – validation, guarantee good fruit stock just, reduce waste, cost savings, this is the value of the data.
據(jù)分析1.jpg)
(green: daily data trend; Yellow: data forecast for the next 10 days
Waiting for an analyst’s long schedule? Can you do your own analysis?
Data analysis, an analyst with multiple departments, sometimes needs to get data from, 2, 3 days have passed, quite apart from the analysis results is what you want, in terms of timeliness, the meaning of the data results also decreases, how to change its own “exclusive analysts’ ~
The whole process of data analysis:Identify indicators — data collection — data integration, data processing/modeling, data analysis, data presentation, and report reporting.
? determining index:I’m not going to talk about it, but let’s go to the first problem.
? data collection:It can be obtained through the company database, which can be obtained through a third-party platform and obtained through some recorded local data.
? data integration:Operating people who want to see too many data, a database, there are all sorts of the third platform of data (their Allies, statistics, marketing, public, etc.), each time need to fetch the data from different platforms, is too scattered, it is best to centralized management of data in a data platform.
? data analysis:The method of reference analysis, such as “summing, counting, same-month, multi-granularity,” etc., is generally solved by writing formula in excel.
? Data presentation (visualization):To put it simply, how to make a map, please learn the third question directly.
? reporting:Report the data to the leader through tables, charts, or other forms.
How do you not rely on analysts to do your own data analysis?
(1)Learn some data analysis theories. (data thinking)
(2)It’s important to know and be familiar with your business. (business ideas)
(3)Learn some data analysis tools. (tool assist)
In my personal experience, it is enough to really grasp these facts. After all, we are not professional data analysts, and we can do business analysis well enough!
How to make a good picture of the owner’s satisfaction?
No boss likes cluttered form data, and the level of appearance is king. To put it simply, it’s how data is visualized, which makes the data intuitive and intuitive.
? Analyze the proportion of data:The data of single dimension can be used for the proportion of available pie/ring graph and the data proportion of the analysis of the dimensions, which can be used for the sunrise and rectangular tree plots.
For example, the user sex ratio analysis only “gender” one dimension,useBread/graphic),Male to female ratio is intuitive, such as below are male users more obviously, if a user group in line with the original intention and product characteristics, the way they operate might as well try some “cute”, perhaps this can attract more male customers. Marketing campaigns can also consider selecting a number of technology products as prizes, which may promote the purchasing power of male users and achieve the purpose of activities.
據(jù)分析2.jpg)
(single dimension: user gender analysis)
據(jù)分析3.jpg)
(multidimensional: order analysis of different channels in different regions)
? Analyze the data with the sequential trend:Analysis of the single dimension of the same month can be used in the same monthBiaxial figure。
It is too common to be seen on the same month, and almost all of the data have to be compared to the previous one, so that the “operational value” of the data can be reflected.
The most common is PV, UV and the same month, such as the UV month down, is normal or abnormal. The normal reason is that there may be a certain rule of UV, which may be lower than Thursday, and that data is normal. If there is no regular pattern, the abnormal fluctuation must look for the reason behind, handle the problem as soon as possible, in case of recidivism.
據(jù)分析4.png)
(Single dimension: PV is separated from the UV)
據(jù)分析5.jpg)
(Double dimension: PV and UV are put together)
? Analysis data trend:the most commonly used is…Line drawing, bar graphAlso can be expressed, the intuition is slightly lower than the line graph.
據(jù)分析6.jpg)
(line chart)
據(jù)分析7.png)
(bar graph)
? Analysis of regional distribution:National and provincial distributions are availableAdministrative map,More detailed geographical distribution is availableLatitude map。
User geographic analysis is also very important, which may determine which areas the company’s business will focus on and focus on sales. This is what is required to focus on the company’s advertising data of the regional guidance, for every bidding in the company the millions and millions and correct user geographical analysis can save a lot of unnecessary investment, to save money for the company boss can be pleased.
據(jù)分析8.jpg)
(Administrative map)
據(jù)分析9.gif)
(Dynamic map of the area of shenyang)
據(jù)分析10.jpg)
(The number of registered users in each province was completed)
? Analyze task progress:Single indicator progress is availableMeasuring figure,Multi-indicator progress is availableThe bullet figure,the completion is clear
據(jù)分析11.png)
(KPI fulfillment of schedule)
據(jù)分析12.png)
(The various indicators are completed)
? Analyze user activity change:useSankey diagram。
據(jù)分析13.jpg)
(User activity changes)
? Analysis of word frequency: Like the user’s job distribution,useWord Cloud,It has a 3D effect.
據(jù)分析14.jpg)
(User position distribution)
?Analytic transformation effect: usefunnel plot.
據(jù)分析15.jpg)
(User consultation conversion rate)
Transformation of case
Before working in a home appliance business company, every site traffic is not low, but the final payment conversion rate is not high, always from traffic – registration can also, in the scan conversion are registered – you can also, but just browsing – pay is not high. By constantly looking for reasons, through the user survey and data analysis (buried) found that most of the users to the payment page, but not so obviously pay for entry in the mobile terminal has caused many users to refuse to buy, I need to change this, of course, the optimized overall conversion rate is increased. It’s really a virtuous cycle through data discovery – the reason – optimization – through data validation
Each chart has a suitable usage scenario, and it is important to use a variety of charts to directly affect the intuitive and aesthetic degree of data.
How to quickly find the problem behind the data?
With so much data work, it’s all about finding problems from the data and optimizing the operational strategy. Whether the data is going up or down, there must be a reason for its change. Here, take the change of user data as an example to find out the way to find the problem quickly
據(jù)分析16.jpg)
? Holiday fluctuation:Most products are affected by holidays and weekends, while office software holidays/weekend data tend to drop, and e-commerce product holidays/weekend data generally rise.
? Online and revised:There are different online orders, such as the launch of marketing activities and new advertising channels. Any changes in the website can be interpreted as “on-line”.
? Exception, failure:Server failure, channel forced offline, website access, link exceptions, link access is not a common situation.
The above three kinds are not, then drill down from the channel to start, see which channel data have abnormality, combine specific problem to undertake analysis. (Ps: sometimes exceptions are found from channels, so the order of this process is not absolute)
None of the above is true, I can’t find the reason, I can only say to the boss: “the reason is not clear, will continue to observe the trend, to confirm its contingency”.
Some of the problems are obvious, some of them need some time to check, and the final meaning of the data should be combined with practice. See the data, find problems, solve the problem, then look at the data, problem solving, or see the data – found that growth – find out why – continue to application, in a word: take the essence to the dregs, you know ~
本文來源于數(shù)據(jù)分析網(wǎng),作者海致BDP。
To Marketers: How Do You Not Rely on Analysts to Do Your Own Data Analysis?,首發(fā)于Cobub。
]]>The product details page is the most easily accessible and resonant page of the e-commerce APP. The quality of the product details page design has a direct relationship with the user purchase conversion rate.Therefore, the good design of the product details page can stimulate users' desire to purchase, dispel misgivings and enhance the trust of users!
Let's take a look at the electricity funnel model: pull new (new users), active (commodities list page, page for details) - buy transformation (order, payment, trade complete) - spread (evaluation, sharing).
How to Make People Buy Buy Buy on December 12th?,首發(fā)于Cobub。
]]>The product details page is the most easily accessible and resonant page of the e-commerce APP. The quality of the product details page design has a direct relationship with the user purchase conversion rate.Therefore, the good design of the product details page can stimulate users’ desire to purchase, dispel misgivings and enhance the trust of users!
Let’s take a look at the electricity funnel model: pull new (new users), active (commodities list page, page for details) – buy transformation (order, payment, trade complete) – spread (evaluation, sharing).

In the process of operating electric business APP, we tend to be the focus on access to new users and to generate income, many people think that as long as there are constantly new users into and someone buy, our APP operation was very successful.In fact, as long as we take effective measures against the product details page, it will be easy to pull new, buy, and disseminate these indicators.Good product details page can bring us more revenue, better customer experience and better APP performance.
Want to talk about is here, in front of the design product details page to fully market user research, user through the analysis of the historical data of consumption ability and interest preference, accurately understand the needs of users, there is not much more.Below, we will discuss the design of the product details page, and give the following five strategies and Suggestions:
1. Reduce the number of buttons and simplify the operation process
Purchased in design process, we can only provide users with a CTA button (call to action, used to motivate the user action button), it can avoid to cause the user to choose difficulties can also encourage users to buy. Since there is only one CTA button, we have to figure out what kind of action the user wants to take. The “add to cart” button gives the user time to think, although it is the user’s point of view, but this can cause a certain disturbance to the user’s purchase behavior. We can think about our own online shopping scene: a lot of times when we add our products to our shopping cart, we will think, wait a while, maybe there will be a discount later? If only “buy immediately” button, this button will induce the user to purchase the item when browsing the product. Acceleration of the purchase process is conducive to the purchase of conversion rate.

2.Magnify the CTA button to stimulate the user to purchase
Magnify the CTA button to make the CTA button appear more visible, allowing users to interact with the product more and stimulate more purchases. The design of the CTA button is too small to be coordinated in the full details page. The “instant buy” button in the atmosphere is more likely to encourage users to click.

3.Guides the user through the text on the CTA button
CTA button intuitive persuasive words such as “buy now” can also, but “accept for their own” very good use of the weakness of human nature of greed, desire, possession of mental state, when to see their favorite things, we all hope that this thing is belong to own.

4.Place star rating in a prominent position on the screen
There’s a lot of information that can be displayed on the screen, and there’s no shortage of star ratings and ratings. Because good grades and reviews can help users quickly learn about the popularity of the product, it can also help to establish an authority in the user’s mind. Second, placing the evaluation in a prominent position on the screen allows users to make a good impression on the product.

5.Add the social sharing button to the product details page to promote communication
Adding social media buttons not only encourages users to share, but also facilitates user sharing. We are mainly used to share items on the current page. But in fact, the true use of marketing should not be limited to the product itself. For example, the record of successful purchase, or the interaction between the buyer and the seller, can be Shared content, which will be more communication than the commodity itself.

The above 5 points suggest that we can combine the A/B test to verify and ensure that the user behavior data we collect is accurate and effective. In the end, I wish you all the e-business friends 12-12 barley!
How to Make People Buy Buy Buy on December 12th?,首發(fā)于Cobub。
]]>試1.png)
Our previous "cohort analysis method is introduced by comparing different period of specific indicators for time window, and today" A/B testing "is introduced by different groups of users on the same time window for comparing different versions of the reaction.
The ABC of A/B Test,首發(fā)于Cobub。
]]>Our previous cohort analysis method “is introduced by comparing different period of specific indicators for time window, and today” A/B testing “is introduced by different groups of users on the same time window for comparing different versions of the reaction.
The so-called A/B test is an experiment to compare two (or more) versions of A web page or APP’s “performance”.The A/B test is essentially an experiment.In this experiment, a page of two or more different solution to show a particular user group (the user based on the possibility of random, there may be specific characteristics), and then according to the statistical data analysis, which on the specified “performance” better.We often face multiple choice of design solutions or marketing strategies, and A/B testing is A great way to solve these problems.
Through A/B testing, we can compare the different versions of the user experience, and in view of the updated version of the web page or APP to ask questions, and then collect the relevant data, analysis and update web pages or APP to our established metrics.
Currently, most of the A/B test tools on the market do not support the allocation of traffic to the allocation of traffic (generally random).As a result, the results of the test can not only reflect the preferences of the target’s core users, but also may mislead the product manager and misjudge the direction of product improvement.In this recommendation user behavior analysis tools Cobub Razor, it can help us to accurately identify user attributes, thus to provide A/B testing flow allocation strategy, to ensure the scientific nature of the flow distribution, the reliability of test results.In addition, Cobub also provides real-time monitoring and data analysis of experimental target indicators. We can optimize the flow strategy in real time according to the analysis results, and help to form the closed loop of product optimization.
試2.png)
The A/B test will help us to generate hypotheses from the interface optimization, which will also help us to make the right decisions based on sufficient data analysis.With the support of A/B test, we can make decisions from the “I think…Turning to data analysis results, “we know…”.By measuring the impact of the updated version on each metric, we can ensure that every update has a positive result.
How does A/B test work?
In A/B test, we can create an updated version of the same page or APP interface.The differences between versions can be very simple, such as changing a single icon or button, or a complete redesign of the page.During the testing process, we showed the original version of the page (call it the control group) to half of the users, and half of the page’s updated version (called the test group).
試3.png)
In the A/B test, we collected user behavior data from the control group and the test group, and then analyzed the impact of the updated version on user behavior.
試4.png)
Why do we needA/B test?
Both individual and team or company, after the analysis of the A/B testing data results, we can use the data to talk, to optimize product, enhance the user experience, let the user behavior towards the direction we want. The A/B test also verifies our assumptions. Sometimes the product changes we make from experience don’t get the results we expect (because our customers don’t let us arrange them). Through A/B testing, we can get away from empiricism and shift to data-driven product development.
A/B test can continuously improve our products and improve user experience, so as to help us achieve various goals, such as registration rate, conversion rate, etc.
Operations team, for example, want to A landing page to improve sales target marketing activities, in order to achieve this goal, we will try to title, visual images, forms, action buttons, and the overall layout of the page for A/B testing.
Each time a change is tested, it helps us determine which changes have an impact on the user’s behavior. Over time, our products will get better and better because of these successful improvements in testing.
試5.png)
A/B testing enables us to optimize our products in marketing campaigns and to let users take action based on our goals.
By testing the AD copy, we can see which version has attracted more users’ clicks.By testing the subsequent login page, we can see which layout can facilitate the user’s purchase.If the changes in each step can effectively get new customers, then the cost of marketing will be greatly reduced.
試6.png)
A/B testing can also be used by product managers and designers to demonstrate new features or change the impact of user experience. The product login, user engagement, pattern, and product experience can all be optimized through A/B test. In conclusion, we can achieve the goal through the A/B test, and verify the hypothesis.
A/B測(cè)試過程
Here is the A/B test framework, which we can use to run the test:
? Data collection:Data analysis of the product allows us to find the problem and find the direction that needs to be optimized. First, we need to collect data, which can start from the high traffic areas of the site or APP, which can help us quickly identify the key to the problem. At the same time we need to look for pages that can improve low conversion rate and high turnover rate.
? Set goals:Our goal is to measure whether the updated version is better than the original user experience and more successful. Goals can be anything, such as clicking a button, linking to a product or completing a registration.
? Generate the hypothesis:Once the goal is clear, we can generate the hypothesis of A/B test, which is used to explain why we feel the newer version is better than the original version. After having this hypothetical list, we can test it in order of the desired results and implementation difficulties.
? To create change:With the front after a few steps, we can on our website or APP to make the desired changes, design the iterative solution, these changes can be the color of the button, the order of the elements on the page switching, hidden navigation or completely redesign. We create these changes to ensure that they meet our intended goals.
? Running test:Start our experiment and wait for the user to participate. In this step, users of our website or APP will be randomly assigned to the control group and test group, every step of the user operation will be record collection, calculation and comparison, to determine the control group and test group on each change.
? Analysis result:The results were analyzed after the experiment was completed. The A/B test will show the experimental data and tell us whether there are significant differences between the two versions of user behavior.
? Release the best version:If the behavior of the test group meets our intended target, then we can continue to improve the product according to the A/B test results. Instead of being discouraged, we can take this test as an experience and generate new assumptions and continue testing.
試7.png)
Regardless of the test result, we should implement the product optimization closed-loop according to the test experience and continuously improve the user experience.
Here are some of the pitfalls that are common during the use of A/B testing:
? Success in trials does not equal improvement
? Randomly select users to participate in the experiment
? Many tests, a little modification
? Block A/B version of human selection
The ABC of A/B Test,首發(fā)于Cobub。
]]>A month out, usually can't adapt to the job or related to the work itself.
The situation of half a year, general and direct superior concerned.
More than 2 years left, basically belong to the recognition company, but the development is limited
In fact, the retention of the product is similar to that of the employee, and the reasons for the short-term retention, interim retention and long-term retention are very different.
Taking Tik Tok and Ease Cloud Music as An Example to Discover Different Requirements of the Three Stages of User Retention,首發(fā)于Cobub。
]]>A month out, usually can’t adapt to the job or related to the work itself.
The situation of half a year, general and direct superior concerned.
More than 2 years left, basically belong to the recognition company, but the development is limited
In fact, the retention of the product is similar to that of the employee, and the reasons for the short-term retention, interim retention and long-term retention are very different.
01
In the short term, we can understand the retention after the user has a preliminary understanding of the product, which means that after the product has been downloaded, it is not deleted immediately or deleted in the next two days.
New users in the app will enter directly after the download is complete understanding of the product stage, this stage, the product main function interface, if the product itself nothing particularly conspicuous window (which can be understood as liao point), or hooked users at once, the possibility of losing customers is very big, after all, most users only early adopters, loss of this kind of problem, the general intelligence (algorithm), or select the content of the type of recommended products have an advantage, information of the class, the short video, the mall or in a class, live class, can use the height of the hot spot content recommended the use of the hook for most users.
I recently in an attempt to understand Tik Tok, for example, he has a big advantage determines the app short-term retention rates are higher than other similar short video, for three reasons, first: Tik Tok itself attribute and user product positioning determines his music video is more characteristic;Second: the high quality of video is determined by the shooting threshold, high standard and the advantage of video processing.Thirdly, the selection mechanism of the home page makes the selection threshold of the user lower, so we can open the APP to play the short video, and the quality is quite high from the view of my days.(I haven’t found the content of the recommendation algorithm on the front page, but in terms of content quality, there should be a large manual intervention mechanism).

Tik Tok the three characteristic determines the user after open the app, can quickly immersed in a short video in high quality, also is the hook users can quickly, that I feel is better than well quickly, quickly in a short video on the choice of, is a very easy thing to do.You recall a boring afternoon when you wanted to see a good movie to see the tangle and ridicule of the movie process.
For content products with distinctive features such as no shaking, they can start from another Angle.According to the 2016 mobile information industry subdivision report released by the headline, today’s headline entertainment interest accounts for 68.29% of the total platform, accounting for the first place.The second most important social information was 67.29 percent, and the third was the funny category, accounting for 46.56 percent.That is to say, it is only a collection of these three points, so the retention rate in the short term will be extremely high for early adopters.
Of course to a content type products, generally USES a strong visual and interactive forms, that is to say, adopt the user can see understand product focus, the use of the product characteristics, let users can easily to fit in is the rapid formation of the product is not low quality, the product function looks quite good first impressions.
It also helps to understand why a good newbie guide is very important for many new products, which is a quick way for users to quickly learn about the product.Novice guidance may include not only the use of products but also the core highlights of the product (including ideas such as craftsmanship, high quality, etc.).
02
For the medium term, more appropriate content and more comfortable functional use become more important.Any one thing, we can from jing period (or early adopters) gradually transition to the peaceful period, when we are accustomed to most of the product function, the function of the product do more delicate, more convenient, for instance, learn more about the current user, recommendation algorithm is more accurate;For example, it’s easier to operate, and to change the original three-step clicks into one step, much like we use a computer for a long time, many functions we tend to use keyboard shortcuts instead of mouse.For example, provide a more personalized visual solution, app for design style, which means that this is a good step from the product to the use.
Netease cloud music song reviews module, this in itself is not a very need to function, but as a function of the icing on the cake effect is very good, a lot of top comments directly led to the user’s mood, strengthen the appeal of the song itself.
易云.jpg)
Further forward, providing more interesting content even if it is associated with a weak core function.Netease cloud music “friends” module, I found that I was unconscious spent a lot of time in the above, there is a short interesting video, wacky GIF animation, good music, but also some small celebrity gossip, itself is the module with music there is not a direct relationship, but he from listening to music and the stars, in the form of a circle of friends (of course his recommendation mechanism not the circle of friends, but with a smart and hot recommended among them, the mechanism of cloud music, after all, friends are mostly weak relationship, and slightly different WeChat), as a cloud music modules, this I think is kept as middle can be for reference.
03
Say again for a long time, also is the senior user’s problems, when users accustomed to the content of the product and function, but there will be a “itch” stage, micro letter do again good, with one or two years later, you might think so, however, much more humorous jokes to see, you can often guess some routines, humor also becomes boring.Papi sauce do you still see it, in the words of a lot of net friend, those routines, besides the trill, he now has such problem, trill embarks from the short music video, that is to say a lot of video will in fixed rhythm of the music and the content, it’s decided to many of his video filming and editing routines are the same, I used a lot of depth around users said video repeat rate is too high, often can see a similar form, the novelty is gradually diminishing.
At this stage, generally three Zhang Daqi products offering, the first name is social, the second call user growth system, the third is called continuous operation stimulus (including form varied topics, hot spots, community).
Social good understanding, the reason we don’t give up WeChat, because it has a lot of our social relations, our concern is not WeChat, but the people on the WeChat, just there is no one product can do WeChat such strong relationship chain characteristics.
Live on yy, devoted to the stranger, a short video class well quickly, trill, diminishing in the freshness of the products, can not afford to build micro letter this strong relationship, weak but is still has a strong relationship between mining.
Live streaming or video, as a way of being lonely and boring, we can see some interesting strangers on the screen, and since it’s human, then nature has personality.
Then the be fond of of weak relationship can dig from the content into a personality like, this can be understood as a form similar to that of the AKB48, the difference is that maybe I was like your best work, later to become fans after I like you as a person’s personality and fun, then work is only part of your personality, in the later, you focus on the anchor may not need the content of the very bright eye, you will be more like, even thought he is true.
This is part of the deep mining of the social weakness of content products.
The growth system, in short, is “a few years after the work honors and some privileges and benefits”, which is not done in detail and expands very much.
Continuous operation stimulus, usually divided into two kinds of circumstances, information, media products tend to produce operation of controversial topics, subject content can often surprise, after all is not, subject to choose the good, may point continuously the following reply.
Mall products tend to make holiday, a double tenth, 618, belong to this category, of course, the continuing operations manufacturing festival belongs to the regularity of, also have a regularity, such as drops, worship for no reason to send coupons, give preferential.
04
Summary, although I said is short medium and long term retained, but the spring is not a specific time short, different users at different levels of products use, reflect individual users of short time might not have the same of the medium and long term process.That’s one thing.
2 it is, I said these products function must points successively, not likely parallel development at the same time, some retained function is, after all, three stages are applicable, just to say which stage the best results, the lower the yield, do the most efficient.
As a recent graduate of the college students, you tell him to high quality business top fortune 500 companies, dry, for him, there is no use, it is better to teach him how to improve the success rate of the interview is really.The same is true for retained solution policy usage.
So that’s a little bit of a little thought for retention, hopefully useful.
內(nèi)容轉(zhuǎn)載自公眾號(hào) 油炸果子
Taking Tik Tok and Ease Cloud Music as An Example to Discover Different Requirements of the Three Stages of User Retention,首發(fā)于Cobub。
]]>
A pretty average number is created with the data of virtual scene, will give our decision making misleading, so we need to acquire an effective method to analyze the real user behavior and user value, this method is a Cohort Analysis (Cohort Analysis).In fact, the data does not lie, but the analysis of the data is not accurate analysis and leads to the incorrect interpretation of the data.
At the same time, there are relatively few studies related to the group analysis in China. Perhaps not all operations know about the group analysis in the same period, but it is a necessary analysis method for every product operation.In the famous "lean data analysis", the soul of test data analysis also mentions the relevant content of group analysis in the same period.
In the same period, group analysis was first used in the field of medical research to observe how the behavior of different subjects varied with time.By monitoring different groups of subjects, medical researchers can observe the effects of different prescriptions and treatments on the subjects and determine the Shared behavioral patterns. ]]>
A pretty average number is created with the data of virtual scene, will give our decision making misleading, so we need to acquire an effective method to analyze the real user behavior and user value, this method is a Cohort Analysis (Cohort Analysis).In fact, the data does not lie, but the analysis of the data is not accurate analysis and leads to the incorrect interpretation of the data.
At the same time, there are relatively few studies related to the group analysis in China. Perhaps not all operations know about the group analysis in the same period, but it is a necessary analysis method for every product operation.In the famous “lean data analysis”, the soul of test data analysis also mentions the relevant content of group analysis in the same period.
In the same period, group analysis was first used in the field of medical research to observe how the behavior of different subjects varied with time.By monitoring different groups of subjects, medical researchers can observe the effects of different prescriptions and treatments on the subjects and determine the Shared behavioral patterns.
So in terms of operations, what is the same cohort?
In the same period, the group belongs to a subgroup of users, which refers to the group of users who have the characteristics of common behavior within the specified time.“Common behavior” refers to the similar behavior in a certain time period, which in addition to sort them out according to different time of new users, may be classified according to different behaviors, such as “in June 2017 for the first time to buy”, “on the second week of October, 2017 products began to reduce the use of frequency”, etc.
Note that the cluster analysis focuses on the differences between groups during the same phase of the customer’s life cycle.
Why is Cohort Analysis important?
In the process of product development, we usually measure product revenue and product user volume as the ultimate measure of success or failure of this product.There is no denying that these indicators are important, but they could not be used to measure the product’s success recently, and most likely will hide some issues which need our attention, such as user engagement has been falling, added in gradually slow, etc.On the analysis of user behavior in the process, we need more detailed measures, so that is better for us to accurately predict product development and by version iteration in a timely manner to product optimization and improvement.
Cohort Analysis is the key to improving the retention of APP users
The success of a product, it says, is not how many downloads it is, but how to keep losing users and how to recall them.
We can’t through downloads to determine the specific situation of the development of the APP, because beautiful download data will mislead us thought APP development is very healthy, but in fact, many users download is lost in a few days.Group analysis is the key to improve user retention.
case
For the first time, users of the APP were analyzed in the same time group and observed their retention for the next seven days.

17461 new users start the APP, for the first time in October 30, with 30.6% of people in these users on the first day to start again, the fourth day 12.2%, 7.9% on the seventh day, and this shows that at the time of the seventh day approximately once every 12 users only one active users.It also means we lose 92% of our users
We need to know which groups have better retention and analyze why.Have we launched a new marketing campaign on that day?Or offers promotions or discounts?Or new features that add video to the product?We can apply these successful strategies to other users to improve user activity and retention.We can also compare the retention of different time periods:
? The preservation of the new lads:
By comparing the different time groups, we can see four days, seven days and so on.These data can give us the key information about user login experience, product quality, user experience, and market demand for products.
? Long-term retention:
By looking at the number of days a group of users are returning to use the APP again, we can see the long-term retention of each cohort, rather than the remaining days of the new APP.
We can know where the user is out, and you can know what’s the feature of active users, what they are doing and so on the one hand, will help us in new quickly find target users, on the other hand we can also affect the new users, let them follow the same route, eventually become loyal users.
Cohort Analysis can help us monitor real user behavior, measure user value and develop targeted marketing programs in real time
For example, our operations team launched a 60-day welcome campaign in September to promote user growth through a series of discounts and offers.Through advertising and social media, we have thousands of users growing every day.Five months later, our user growth was very large, and the leader was very satisfied with the result of our activity.
On the face of it, we have achieved the goal of user growth.However, when we study cohort data, starting from the lifetime value of customers, we will find that new users welcome activities in activity 2 months after purchase rate continue to reduce, by contrast, activity before the new users such as users in August, in the activities of this five months purchase rate has been stable.
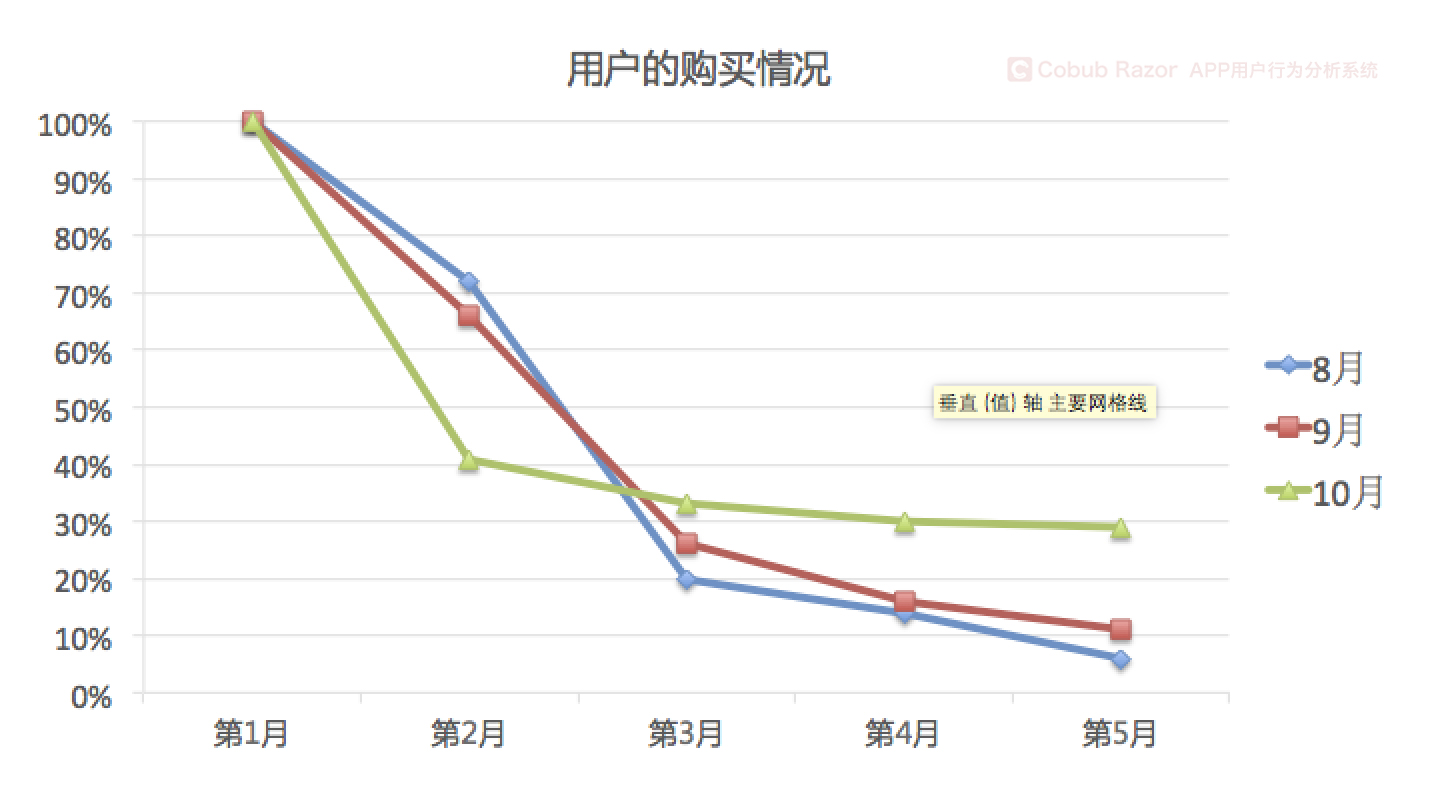
If we only measure our monthly gross income as a measure, we expect revenue growth to come only from the new influx of users.However, user group data following the launch of the activity shows that once the discount activity is over, revenue will decline.The decline in revenue proves that we have not expanded our loyal user base.
As shown above, through the cohort analysis we can real-time monitoring the real user behavior trend, otherwise, we will get wrong judgment because only analyze the overall data and make the wrong decision.By analyzing the behavioral differences of each cohort, we can develop targeted marketing programs.In this case, the operator needs to develop a new strategy to improve user engagement after two months of activity.
How to implement Cohort Analysis?
Start by defining business questions
Defining a business query is a prerequisite for the study of effective results.Business questions define business goals and research attempts to solve them.
Does the customer purchase conversion rate increase after we optimize the product?Is the user turnover rate reduced after the product improvement?We need to iterate and refine these questions to ensure that it is aligned with business objectives.
Define metrics based on business queries
If the purchase conversion rate and user retention rate are the key indicators to answer business questions, we want to understand the user turnover rate and the final purchase conversion rate from registration to completion of purchase.
Definition cohort
In the previous cases, the group was based on the user who purchased the account within a week of creating an account.In other cases, we can define a group in a different way, for example, a content APP that we might post within 24 hours of creating an account.
Analyze group data over the same period
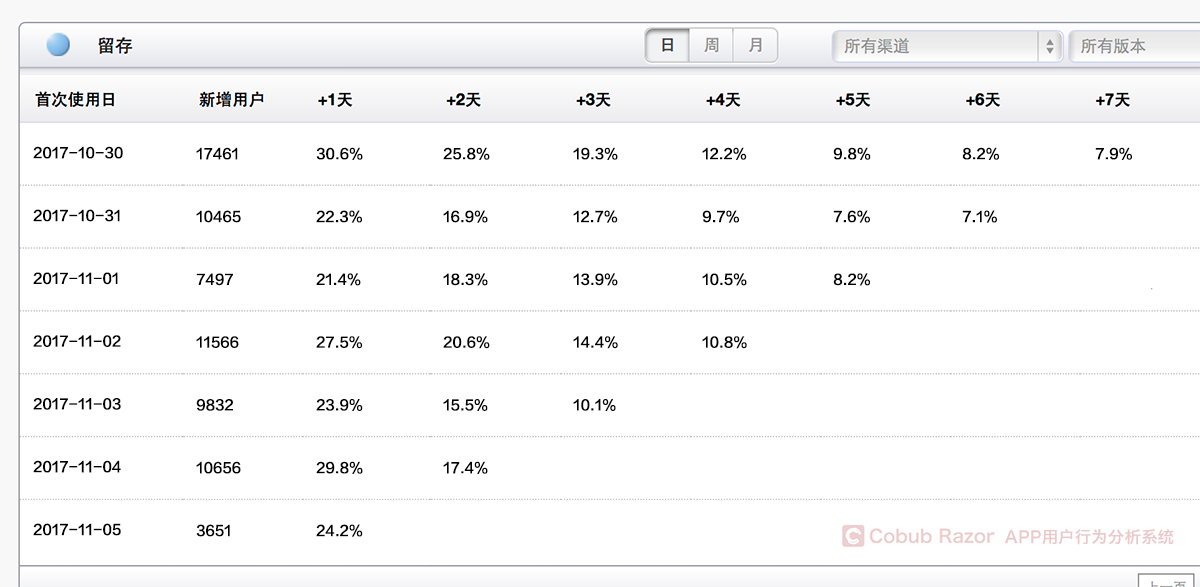
We also in a cohort of typical form, for example, rows horizontally for natural number, longitudinal for every new clients, forms the internal is to calculate retention rate every day, usually the retention rate of lateral will stay some days later in a relatively stable state, we can see from the picture, keep stable in 5 days.This means that the users are stable.Otherwise, if the retention rate keeps going down, it’s going to go to zero someday.
Let’s look at the longitudinal retention data, and if a product is in healthy development, this data should be getting better and better.Obviously this product is not, the PM should constantly improve the product according to the historical data, improve the user experience, thus improve the retention rate!
Conclusion
Cohort Analysis in the same period will help us to analyze user behavior more deeply and reveal the problems covered by the overall measure.In the current situation where the marketing mode and the activity effect are changing, learning to use the same period group analysis can help us to predict the future income and product development trends.
]]>