First Siam

Python USES Deep Neural Networks to Identify Siamese and British Short.,首發(fā)于Cobub。
]]>First Siam
Second short

Have you ever been able to identify Siam and British short? Probably, it doesn’t seem to work. This is because there are too few materials, and we can see that these two pictures can be extracted from each other with too few short features. What if we Siam short put 100 picture, the short put 100 picture for your reference, and give a Siamese or English is just a photo can be identified is that a cat, if not recognized, also has a 90% can guess may be right. So if you provide 500 pictures of Siamese 500, are you more likely to guess right?
How do we identify Siamese and British short? It is first summarized the characteristics of the two cats such as facial color, eye color, etc., when have a picture to identify short, we will see if facial color, eye color can be characteristic of Siam.
Will computers be able to identify the two cats as well, after learning how to identify Siamese and English short?
So how do computers recognize images? Let’s look at how computers store images.

The image in the computer is a pile of Numbers in order, 1 to 255, which is a black and white picture, but the color varies from three primary colors – red, green and blue.
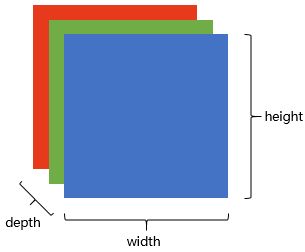

In this way, a picture is a cuboid in a computer! A cuboid with a depth of 3. Each layer is a number between 1 and 255.
To get a computer to recognize a picture, you have to let the computer know that it wants to recognize the features of the short image. Extracting features from images is the main task of identifying images.
Here is the main character, roll and neural network.(Convolutional Neural Network, CNN).
The simplest convolutional neural network looks like this.
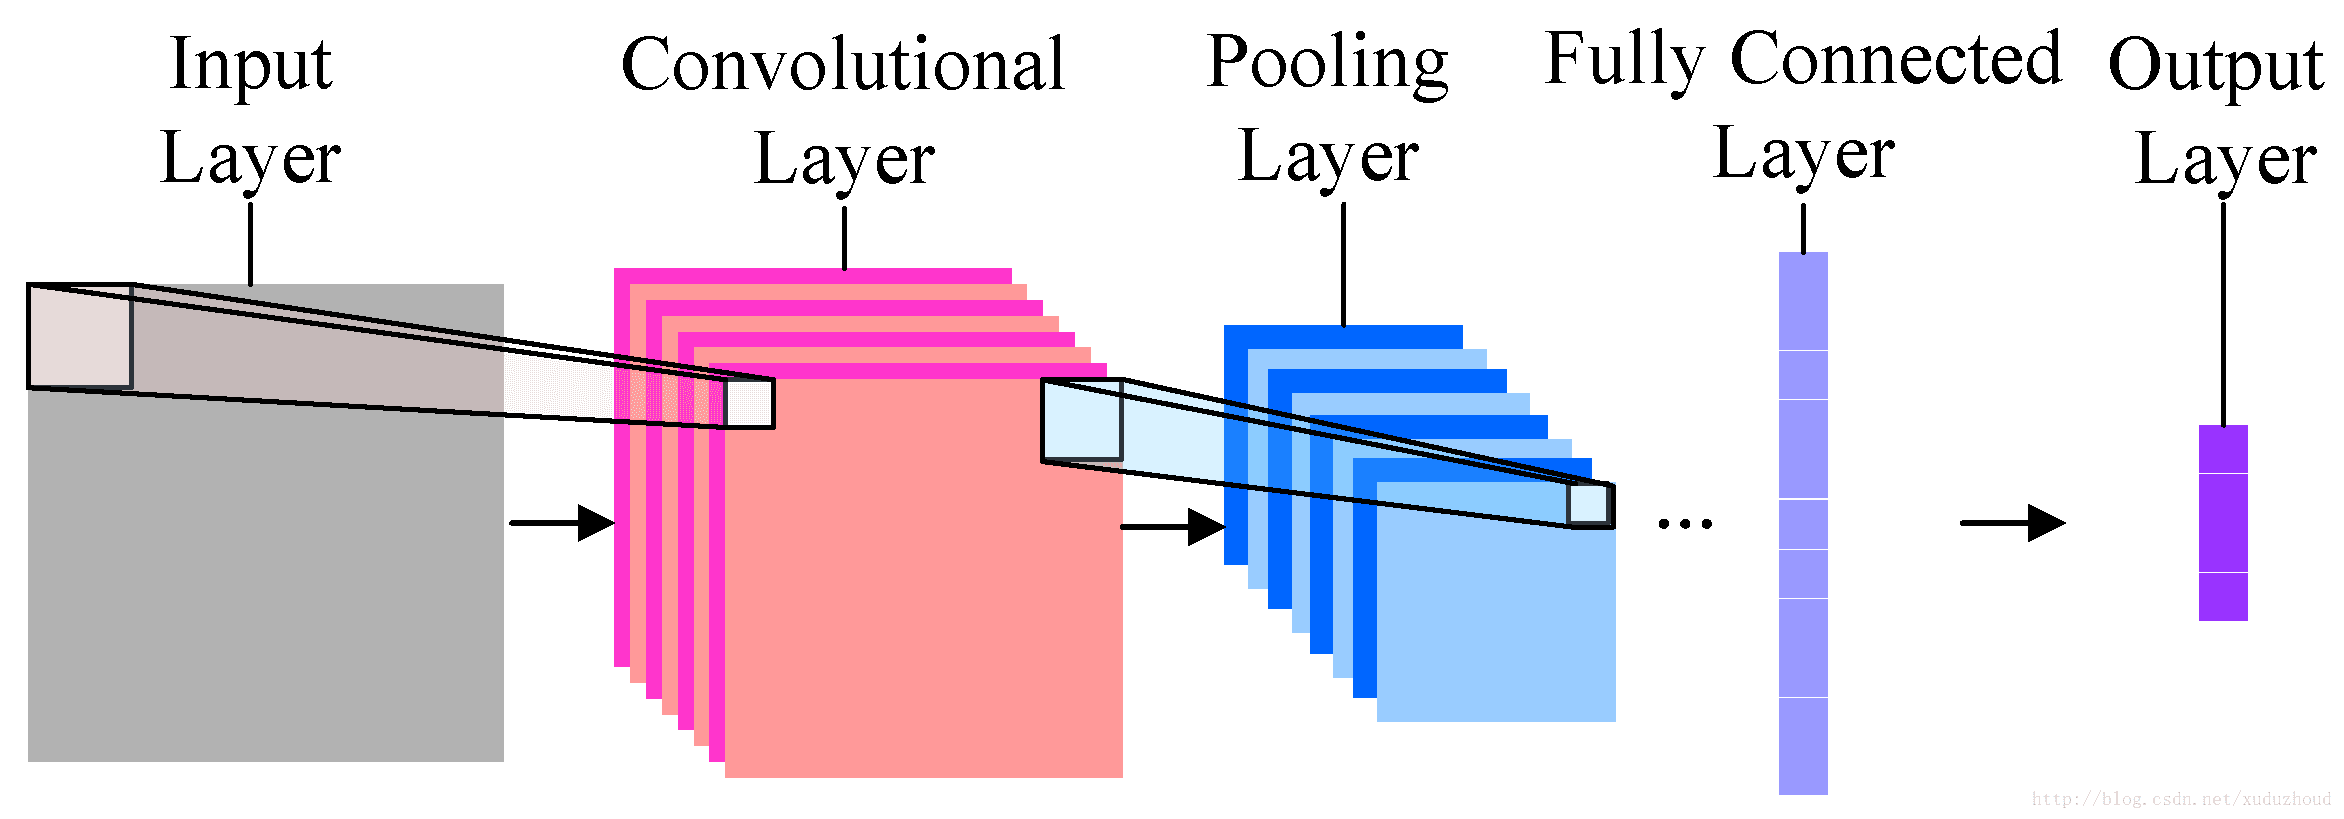
It is divided into input, convolution layer, pooling layer (sampling layer), full connection and output. Each layer compresses the most important identifying information and transmits it to the next layer.
Convolution layer: to help extract features, the deeper (multi-layer) convolutional neural network will extract more specific features, and the more shallow network extraction will be more obvious.
Pooling layer: reduces image resolution and reduces feature mapping.
Full connection: flattening the image feature, treating the image as an array, and using the pixel value as the characteristic of the value in the predicted image.
Convolution layer
The convolution layer extracts the features from the picture, and the image is stored in the computer according to the format we mentioned above (cuboid). First, extract the feature and how to extract it? Use the convolution kernel (weight). Do the following short operation:
You look at the left and right matrices, and the matrix sizes are from 6×6 to 4×4, but the size distribution of the Numbers seems to be consistent. Look at the real picture:

The picture seems to be blurry, but what about the size of the two pictures? It’s in the following way: same padding.
You add a circle of 0 around the matrix of 6×6, and then you have a 6×6 matrix, and why you add a circle of 0 is related to the size of the convolution kernel, the step length and the boundary. Do it yourself.
The above is a demonstration of using a 3X3 matrix on a 6×6 matrix. What does it look like to convolve in a real picture? The diagram below:
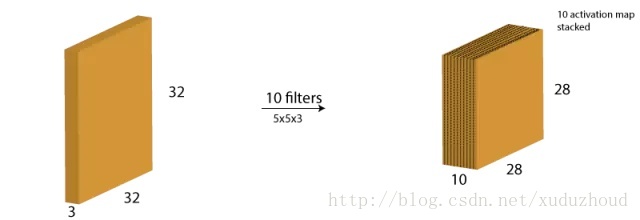
A 28x28x10 activation map (activation diagram is the output of the convolutional layer) is obtained by convolution of a 32x32x3 graph with 10 5x5x3 filters.
Pooling layer
Reduce image resolution and reduce feature mapping. How do you reduce it?
Pooling is done alone on each depth dimension, so the depth of the image remains the same. The most common form of the pooling layer is the maximum pooling.
You can see that the image is obviously getting smaller. As shown in figure:
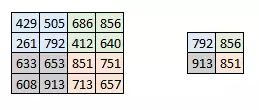
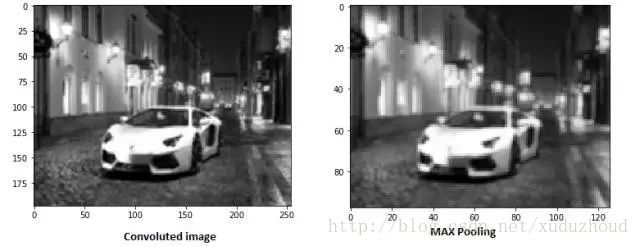
A new graph is obtained by extracting the maximum value of 2×2 on the two-dimensional matrix of each layer of the activation graph. The real effect is as follows:
With the increase of convolution layer and pooling layer, the characteristics of corresponding filter detection are more complicated. As you accumulate, you can detect more and more complex features. There is also a problem of convolution kernel optimization, and multiple training to optimize the convolution kernel.
The following USES apple’s convoluted neural network framework, TuriCreate, to distinguish Siamese and English short. (first of all, I have been working late in win10 to reload the computer more than 3 times. The system should have WLS, and it is convenient to install turicreae under the enterprise version, MAC system and ubuntu system.)
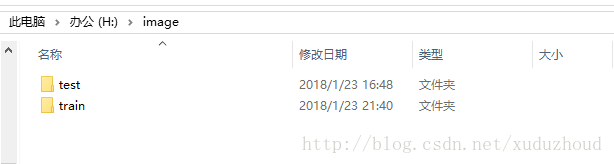
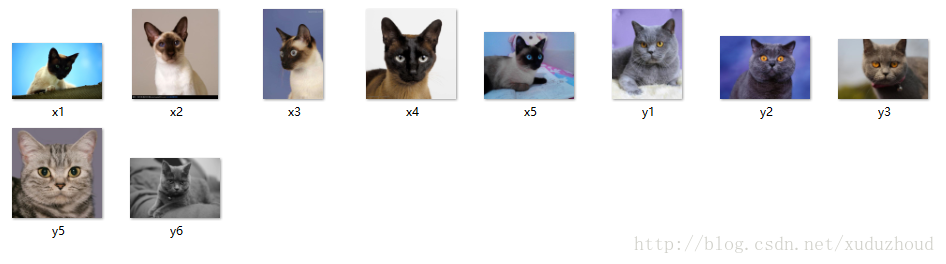
First of all, prepare to train with 50 pictures of Siam, 50 long. The test USES 10 pictures.
Code :(development tool anaconda, python 2.7)


The data is placed in the image directory of the h disk, and I am installing ubuntu in win10, so the h disk is hung in MNT/down.
Test files :(x refers to Siam, y refers to short, so the name is to distinguish the cat type from the test pictures in the code)
test_data[‘label’] = test_data[‘path’].apply(lambda path: ‘xianluo’ if ‘x’ in path else ‘yingduan’)
The first results are as follows:
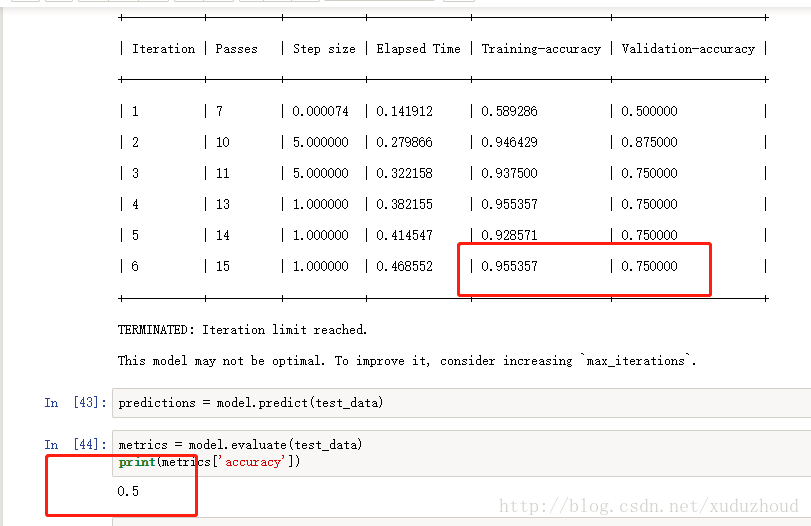
The accuracy of the training accuracy is 0.75 and the accuracy is 0.5. Well, it seems that the study is too little, and it will take three years to simulate the five years of the college entrance exam, which will increase the number of Siam and English short pictures to 100. I’m looking at the results.
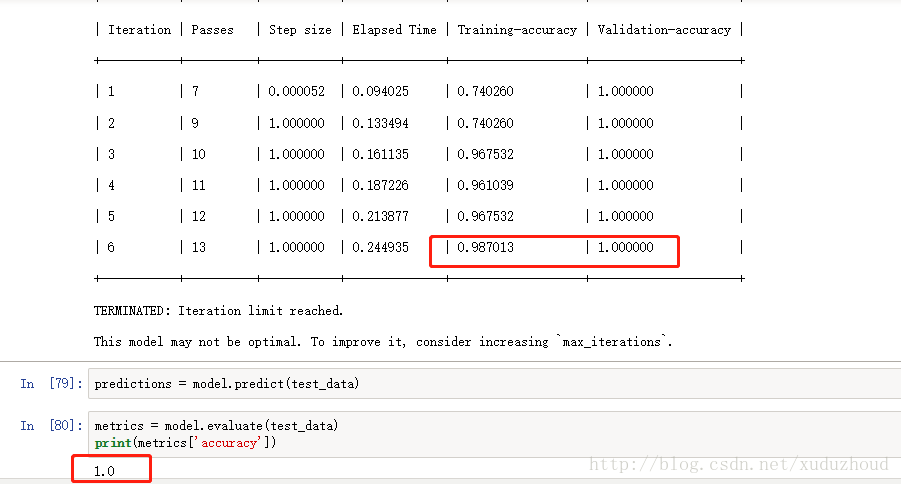
The accuracy of the training was 0.987, the accuracy of the test was 1.0, and the accuracy was 1.0.
See the results of turicreate recognition:
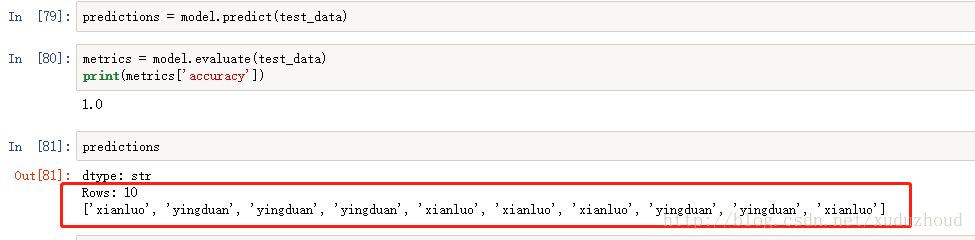
Our actual picture of the cat is :(red is the type of the real cat – in the code, according to the image name, green is the type of cat identified)
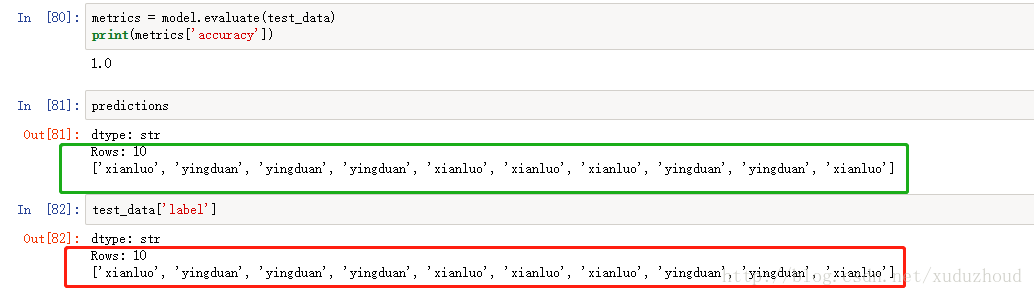
You can see that the two are consistent. The cow forces the training data only 200 pictures, can achieve this effect.
Python USES Deep Neural Networks to Identify Siamese and British Short.,首發(fā)于Cobub。
]]>Why Can’t You Help Clicking It?,首發(fā)于Cobub。
]]>How exactly is this habit developed?
Why do we habitually open an App?
Why do some products stop us from losing our addiction to other products?
Is there any secret to making users more comfortable with your product?

According to cognitive psychologists, the so-called habit is a kind of “unconscious behavior that is produced in the context of the situation”, which we make almost without thinking about it.These days, the products and services we take for granted are changing our every move, and that’s what the product designers were trying to do.That is to say, our behavior has been designed unconsciously.
How do these companies manage to influence users’ habits and control their thinking with just a few encoded characters on their electronic screens?What are the factors that make people want these products?
Making users develop habits and dependencies is an essential element of many products.Nowadays, more and more enterprises have realized soberly, with only has a huge customer base is not enough to constitute a competitive advantage, the user the product a high degree of dependency is the key to decide its economic value.
So, are you ready to learn more about cultivating positive user habits?And then, looking down, you’re going to get a whole new understanding of the addiction model.
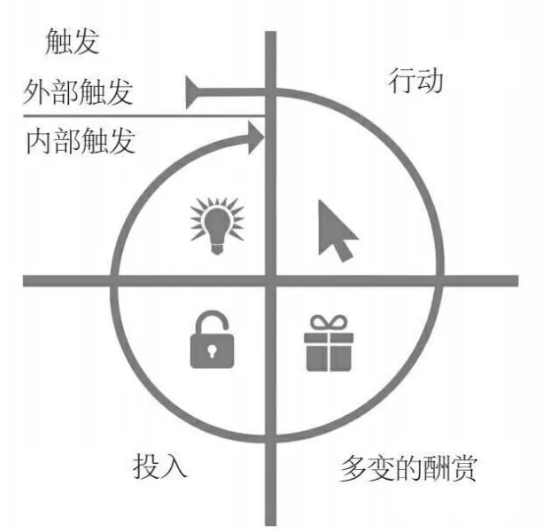
The four stages of the addiction model – trigger, action, variable reward, commitment
Trigger: remind people to take the next step
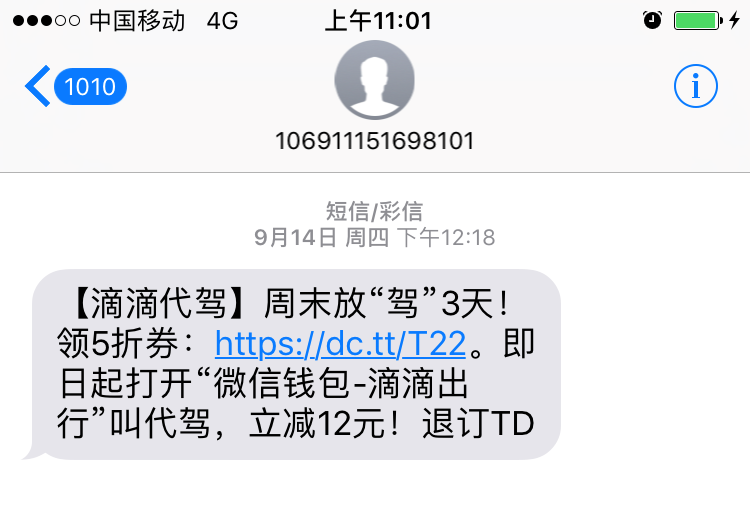
Triggering is the first stage of the addictive model, which triggers the user to trigger action.There are two types of triggers: external triggers and internal triggers.Let you produce habitual rely on those products are often the external trigger the first to play a role, it is through the information penetration in all aspects of your life to guide you to take the next step, such as email, website links, or the application icon on the phone.
Use an external trigger is just the first step, trigger is the inner core, it through the user memory storage in various association to remind them to take the next step, negative emotions can often act as internal trigger.Develop habits to develop product designers need to consider the user’s psychology, to understand those likely to be internal trigger emotions, and to know how to use external trigger to help users to take action.

Action: the direct response of people when they expect a reward
The trigger is action.If they fail to act, the trigger fails to take effect.Dr Fogg, of Stanford university, argues that to get people to act, three elements are essential: motivation (M), ability (A), triggering (T).I’ll write it in terms of the formula, which is B= MAT.
Triggers remind you to take action, and motivation determines whether you are willing to take action.The motivation for users to use products is based on people’s pursuit of happiness and the avoidance of pain.The pursuit of hope, the avoidance of fear.And because people want to be identified, they hate being rejected.So, as long as your product can give users happiness, hope and identity, it can be the motivation for user action.
With an inner itch (trigger), there is a willingness to tickle, and users can easily “scratch”.The ease of use of the product directly affects the user’s usage of the product.To successfully simplify a product, we have to clear the way for users to use the process.Fogg, summarizes the influence degree of task difficulty of six elements: time required to complete this activity, economic investment, physical, mental, and others on acceptance of this activity, and the degree of match between the activity and routine activities or contradiction.When designing the product, figure out what is preventing the user from completing the activity.Is the user no time, or no money?Is it a busy day and don’t want to think again, or is the product too difficult to operate?To win hearts, you have to make your product easy and easy to navigate.
Therefore, to increase the incidence of preconceived behaviors, the trigger should be obvious, the behavior should be easy to implement, and the motivation should be reasonable.
Changeful reward: satisfy the user’s demand, arouse the desire to use
In the third stage, your product will be able to satisfy users’ needs and arouse their desire to use more.What drives the user to take action is not the reward itself, but the desperate need to be rewarded.The difference between an addiction model and a normal feedback loop is that it can inspire a strong desire for something.The feedback loops around us are not uncommon, but the feedback loops that can be seen in the results do not help to create the inner desire.
The variable reward of “installation” of products is a magic weapon used by the company to attract users.Fundamentally, variable rewards must meet their needs while appealing to users.There is often more than one reward for products or services that can kill users in seconds.Products that don’t have the advantage of being in a variety of variability have to be constantly updated to keep up with The Times.
Social raise reward
The interpersonal rewards obtained through interaction with others.For example, when a friend gets married, he sends out a circle of friends and receives a wave of blessings, which is a social reward.We like our “circle”, enjoy the “likes” of others, and expect “comments” from others.Social rewards can make users crave and expect more.
Prey to reward
Get resources or information.Such as microblogging, microblogging began to attract people, because people as long as the repetition of a “rolling” behavior, can search to the interesting information that oneself like, this is hunting reward mechanism, content variety provides users with unpredictable attractive experience.
Reward yourself
Experience the sense of manipulation, the sense of accomplishment, and the sense of closure.The “upgrade” in the game affects the evaluation of mastery and ability of the self, and the game rules of upgrading and acquiring privileges can satisfy the players’ desire to prove their own strength.Even mundane emails, the number of unread emails in mailboxes are like tasks for many people, a task that needs to be done.
The variable reward is a powerful tool to attract users.Insight into why people habitually rely on products helps designers to design their products well.
Input: through the user’s input to the product, cultivate “repeat customers”
But it’s not enough to get the product to the user’s mind.
A one-night red product often has a good trigger, an easy operation, and a rich social reward.But without the ability to “invest” in a long time, hot style will lose users’ attention over time.
It turns out that the more we invest in things, the more likely we are to think of it as valuable, and the more likely we are to be consistent with our past actions.Finally, we change our preferences to avoid cognitive dissonance.This is the last stage of the addiction model, and it is a stage where users have to invest.The input phase is related to the customer’s expectation of long-term reward, which has nothing to do with timely satisfaction.
When a user provides their personal data and social capital for a product, spending their time, energy, and money is what has happened.In other words, investing doesn’t mean letting users spend money; it means the behavior of the user can improve the quality of subsequent service.Add attention, add to the collection, expand the virtual assets, understand the new product functions, all these are the input that users pay to improve the product experience.These inputs have an effect on the first three stages of the addiction model, and triggers are more likely to form, and action is more likely to occur, and reward is more attractive.
You must say, everything has a routine, then know the routine, how to reverse the pattern?
As a product manager, you can use the addiction model to compare your products:
What do users really need?What pain can your product alleviate?(internal trigger)
What attract users to your product?(external trigger)
What is the simplest operation a user can take when expecting a reward?How do I simplify this operation?(action)
Are users satisfied with the reward, or do they want more reward?(variable reward)
What are the “drips” that users make to your product?Do these inputs help to load the next trigger to improve product quality during use?(input)
If you are a user and learn about these “design patterns”, you can take targeted “anti-design, anti-pattern”.Check your daily actions: what situations do you automatically run on an App?When is the easiest time to swipe your phone?What are the driving forces behind it, to kill time, or to relieve stress?Make a note of it.Find your own behavioral patterns and intrinsic drivers to consciously control your behavior.
文/ 小歐 微信公眾號:中歐國際工商學(xué)院
本文改編自《上癮:讓用戶養(yǎng)成使用習(xí)慣的四大產(chǎn)品邏輯》一書
Why Can’t You Help Clicking It?,首發(fā)于Cobub。
]]>1 Ambari profile
Apache Ambari project by developing software is the purpose of the hadoop cluster configuration, monitoring and management, in order to make the management more simple hadoop.Ambari also provides a RESTful interface implementation based on itself of intuitive, easy-to-use web management interface.
Ambari allows system administrators to the following:
1. Provide installation management hadoop cluster;
2. Monitor a hadoop cluster;
3. The extension ambari custom service management functions.
Ambari Installation and Custom Service Initial Implementation,首發(fā)于Cobub。
]]>1 Ambari profile
Apache Ambari project by developing software is the purpose of the hadoop cluster configuration, monitoring and management, in order to make the management more simple hadoop.Ambari also provides a RESTful interface implementation based on itself of intuitive, easy-to-use web management interface.
Ambari allows system administrators to the following:
1. Provide installation management hadoop cluster;
2. Monitor a hadoop cluster;
3. The extension ambari custom service management functions.
2 Basic conditions needed for cluster
2.1 The demand of the operating system
? Red Hat Enterprise Linux (RHEL) version 5. X or 6. X (64);
? CentOS v5. X, 6. X (64) or 7. X.
? Oracle Linux version 5. X or 6. X (64);
Selection of this document is the CentOS version 6.5 (64);
2.2 System based on software requirements
On each host to install the following software:
(1) yum and RPM (RHEL/CentOS/Oracle Linux);
(2)zypper(SLES);
(3)scp,curl,wget;
2.3
The demand of the JDK
Oracle JDK 1.7.0 _79 64 – bit (default)
Its 7 64 – bit (SLES does not support)
3 Before installing the software prerequisites
3.1 Ambari and the conditions needed for monitoring software
Ambari before installation, in order to guarantee ambari services and the normal operation of the various monitoring service, according to different operating systems, the need to determine some already installed software version, software version must conform to the requirements listed below.I.e., if the existing system has the following software, version must be exactly the same as that of the versions listed below, if not the installation program will be installed on its own.
Software configuration precedent chart 3-1 table


3.2 Ambari and HDP version compatibility
Due to a software version upgrade, compatibility between versions due to the version may cause some problems.
Table 3-2 version compatibility

4 Install examples
In this paper, the choice of system and the software version, shown in the table below:
Table 4-1 system and software version
![]()
4.1 Installation Ambari before the operation of the system
4.4.1 configuration host name
Ambari cluster configuration information is through the fully qualified hostname to determine the cluster machine information, so you have to make sure it is the host name.
4.1.2 Configure cluster information
Hosts file on each machine to do mapping configuration, command is as follows:
# vi /etc/hosts
Then add the following content:
Table 4-2 IP mapping information table

4.1.3 Configure SSH password free exchange
First of all, the primary node and other nodes are executing the following command, to ensure that each machine can produce the public key.
![]()
Then enter all the way. Then each node’s public key to form a new authorized_keys file, then distributed to each node. Thus, completed each node from the login operation.
4.1.4 Configure NTP time synchronization
In the first place on the primary node to do the following:
(1) install the NTP time server:
#yum install ntp
(2) modify the NTPD configuration file
(3) open the time synchronization server
#sevrice ntpd start
(4) in each from the other nodes to do the same operation, thus the NTP synchronization is complete
4.1.5 Closed selinux
Permanently closed SELinux
# vi /etc/selinux/config
Change the SELINUX = enforcing to SELINUX = disabled
Restart to take effect, restart command as follows:
# reboot
4.1.6 Close iptables firewall
Permanent closure (need to restart)
# chkconfig iptables off
(need to restart the firewall temporarily shut down the firewall services)
service iptables stop
Check the firewall status
# chkconfig –list|grep iptables
Note: other services under Linux can use the above command to perform opening and closing operation
Restart to take effect, restart command as follows:
# reboot
4.2 Create yum local source
First check whether the master node HTTPD installation server, the command is:
rpm -qa |grep httd
If not, the installation, the command is:
#yum install httpd
Start the HTTPD
#service httpd start
chkconfig httpd on
All the files inside the folder and subfolders granted the same rights, the command is:
chmod –R ugo+rX /var/www/html
Open the network
vim /etc/sysconfig/network-script/ifcfg-eth0
Modified to onboot = yes
After successful installation, Apache working directory in/var/WWW/HTML by default.
Configuration:
Check whether the port is occupied, Apache HTTP service using port 80
[root@master ~]$ netstat -nltp | grep 80
If there is a footprint, installed after the need to modify the Apache HTTP service port number:
[root@ master ~]$ vi /etc/httpd/conf/httpd.conf
Modify the listener port, Listen to other port 80.
To download the installation files in the/etc/WWW/HTML, then start
[root@ master ~]$ service httpd start
Can check my http://master in the browser to see some of the Apache server page information, said started successfully.
5 The preparation for installation of completely offline Ambari
The difference between offline and online installation yum use different warehouse location, namely the remote installation package in the warehouse a share in local resources such as copies, and then create these resources in the yum warehouse package folder local repository package, can be installed in accordance with the online way to go.But needed to be resolved offline installation Ambari RPM package dependency problem, the first to make sure that postgresql8.4.3 has been installed, or a local postgresql8.4.3 warehouse.
5.1 Prerequisites
Ambari offline installation, you need to use yum, if it is a new installation of operating system, may lack a lot of necessary conditions, the following form according to the order of the once upon a time in the future, in turn, has achieved certain conditions, if can skip those conditions.
Because of complexity of the software operating system itself, such as the installation of tooltips have other required software or existing software upgrades, according to clew to solve it.
5.2 Establish a local repository
HTTP service installed on a machine within the cluster, and then will provide the tar packages or put the RPM package on the machine/var/WWW/HTML directory can be the default directory (Apache) under decompression, the best in this directory to create a new directory, all ambari tar packages and HDP and HDPUTIL is placed in it and extract the tar package, if the machine does not have to manually install PostgreSQL, will provide the software packages together into the local repository.
5.3 Set yum is not check GPG key
Tested off-line yum install Hadoop cluster, it is GPG key check to install software and lead to errors, can through the closed system at this time of yum GPG check to avoid mistakes
# vi /etc/yum.conf
Set gpgcheck attribute value is 0
gpgcheck=0
5.4 Installation ambari services
# yum –install ambari-server
5.5 Ambari Settings
# ambari-server setup
Will appear after the operation whether enter ambari – server daemon, choose the JDK, configuration information such as database, can undertake choosing according to the requirements of the system itself.
When there is a “Ambari Server setup completed successfully”, explain Ambari – Server configuration is successful.To be sure, the database of installation option is a PostgreSQL database, in which the user and the database is the default in advance good;If choose the MySQL database, the need before installing the Ambari – server build user, giving permission, built a database, and so on.
Then start ambari – server, according to the need to install the hadoop ecosystem services.
The custom service service
1 Ambari custom extension service
From the first part, the ambari for secondary development function, the main job is to research the components such as integrated into the ambari, monitoring and management. This paper is to integrate redis.
First, because the service is belonging to the stack, so it decided to customize a service belongs to which stack., again because you have installed HDP2.5.0 stack, so this paper will set the service to place under the stack of HDP2.5.0. New service called: redis – service, including structure diagram as shown in the figure below:

Including configurate the XML file to configure this module call main installation is complete package service main q control in the life cycle of python file, metainfo. The XML file is defined mainly asked some attribute of the service, the metrics. The json and widgets. Json controls the service interface diagram shows.
The metainfo. XML instance as follows:
2.0
REDIS-SERVICE
Reids
My Service
1.0
MASTER
Master
MASTER
redis
1
PYTHON
5000
SALVE
Slave
SLAVE
1+
PYTHON
5000
any
Second, we need to create a Service life cycle control script master. Py and slave py.Here need to ensure that the script path and in the previous step metainfo. In XML configuration path is the same.The two Python script is used to control the Master and Slave module of life cycle.The meaning of the script function as well as its name: install is install call interface;Start, stop, respectively is start-stop call;The Status is regularly check the state of the component invocation.The master. Py and slave. Py template for:
Master.py
class Master(Script):
 def install(self, env):
   print "Install Redis Master"
 def configure(self, env):
 print "Configure Redis Master"
   def start(self, env):
 print "Start Redis Master"
   def stop(self, env):
   print "Stop Redis Master"
   def status(self, env):
 print "Status..."
if __name__ == "__main__":
  Master().execute()
Slave.py
class Slave(Script):
 def install(self, env):
 print "Install Redis Slave"
 def configure(self, env):
 print "Configure Redis Slave"
 def start(self, env):
 print "Start Redis Slave"
 def stop(self, env):
 print "Stop Redis Slave"
 def status(self, env):
 print "Status..."
if __name__ == "__main__":
 Slave().execute()
Again, the redis RPM installation file into the HDP installation package/var/WWW/HTML/ambari/HDP/centos6 / directory.
Again, restart ambari – server, because ambari server only when the restart will read Service and Stack configuration.The command line: ambari – server restart.
Finally, the login Ambari GUI, click on the lower left corner of the Action, select Add Service.The diagram below:

At this point you can see in the list of installation service Redis service. Then check whether the service installation is successful.
2 Ambari implement custom extensions service interface display
Service in the first quarter of the second chapter mentioned metircs. Custom json and widget. The json, the widget is a Ambari figure controls appear in Web Metrics, it will according to the value of the Metrics, to make a simple aggregation operation, finally presented in figure control.Widget is Ambari further enhance the ease of use, and can be configured.Widget is displayed AMS Metrics collected properties.
Then last here, including the metrics. Json template for:
{
  "REDIS-MASTER": {
    "Component": [
      {
        "type": "ganglia",
        "metrics": {
          "default": {
            "metrics/total_connections_received": {
              "metric": "total_connections_received",
              "pointInTime": true,
              "temporal": true
             },
           "metrics/total_commands_processed": {
             "metric": "total_commands_processed",
             "pointInTime": true,
             "temporal": true
             },
           "metrics/used_cpu_sys": {
              "metric": "used_cpu_sys",
              "pointInTime": true,
              "temporal": true
            },
           "metrics/used_cpu_sys_children": {
             "metric": "used_cpu_sys_children",
             "pointInTime": true,
             "temporal": true
            }
            }
            }
      }
      ]
      }
      }
widget.json:
{
  "layouts": [
    {
      "layout_name": "default_redis_dashboard",
      "display_name": "Standard REDIS Dashboard",
      "section_name": "REDIS_SUMMARY",
      "widgetLayoutInfo": [
        {
         "widget_name": "Redis info",
         "description": "Redis info",
         "widget_type": "GRAPH",
         "is_visible": true,
      "metrics": [
         {
          "name": "total_connections_received",
          "metric_path": "metrics/total_connections_received",
          "service_name": "REDIS",
          "component_name": "REDIS-MASTER"
         }
         ],
      "values": [
         {
          "name": "total_connections_received",
          "value": "${total_connections_received}"
         }
         ],
      "properties": {
        "graph_type": "LINE",
        "time_range": "1"
       }
       }
       }
At this point, restart ambari – service, command is as follows:
ambari-server restart
3 Data acquisition and sending
Using shell script to run redis information data acquisition and one-time send to the metrics of the collector, the script is as follows:
#!/bin/sh
url=http://$1:6188/ws/v1/timeline/metrics
while [ 1 ]
do
total_connections_received=$(redis-cli info |grep total_connections_received:| awk -F ':' '{print $2}')
total_commands_processed=$(redis-cli info |grep total_commands_processed:| awk -F ':' '{print $2}')
millon_time=$(( $(date +%s%N) / 1000000 ))
json="{
 \"metrics\": [
 {
 \"metricname\": \"total_connections_received\",
 \"appid\": \"redis\",
 \"hostname\": \"localhost\",
 \"timestamp\": ${millon_time},
 \"starttime\": ${millon_time},
 \"metrics\": {
 \"${millon_time}\": ${total_connections_received}
 }
 },
 {
 \"metricname\": \"total_commands_processed\",
 \"appid\": \"redis\",
 \"hostname\": \"localhost\",
 \"timestamp\": ${millon_time},
 \"starttime\": ${millon_time},
 \"metrics\": {
 \"${millon_time}\": ${total_commands_processed}
 }
}
 ]
}"
echo $json | tee -a /root/my_metric.log
curl -i -X POST -H "Content-Type: application/json" -d "${json}" ${url}
sleep 3
done
Run the following commands (note here is that parameters 1 is the Metrics of the Collector machine, is not a Ambari Server machine) :
./metric_sender.sh ambari_collector_host total_connections_received redis
Process if no accident, wait for 2-4 minutes to interface with data display. Through the above operation, can be implemented to include ambari not in monitoring management software to monitor.
Ambari Installation and Custom Service Initial Implementation,首發(fā)于Cobub。
]]>How do we get the push messages to the desired effect?APP operators must pay close attention to the behavior of users, have a clear preference for users' interests, and push the content of interest to different groups of users at the right time.The perfect push messages are valuable to the user, which can help the product to improve the user experience and increase the user's liking.
Who: Object
What: Content
When: Time
Where: Situation
Why: Reason ]]>
How do we get the push messages to the desired effect?APP operators must pay close attention to the behavior of users, have a clear preference for users’ interests, and push the content of interest to different groups of users at the right time.The perfect push messages are valuable to the user, which can help the product to improve the user experience and increase the user’s liking.
Who: Object
What: Content
When: Time
Where: Situation
Why: Reason
Figure out these 5 Ws, then we can push messages satisfying users’ need.
1. Why: Why do we push this message?
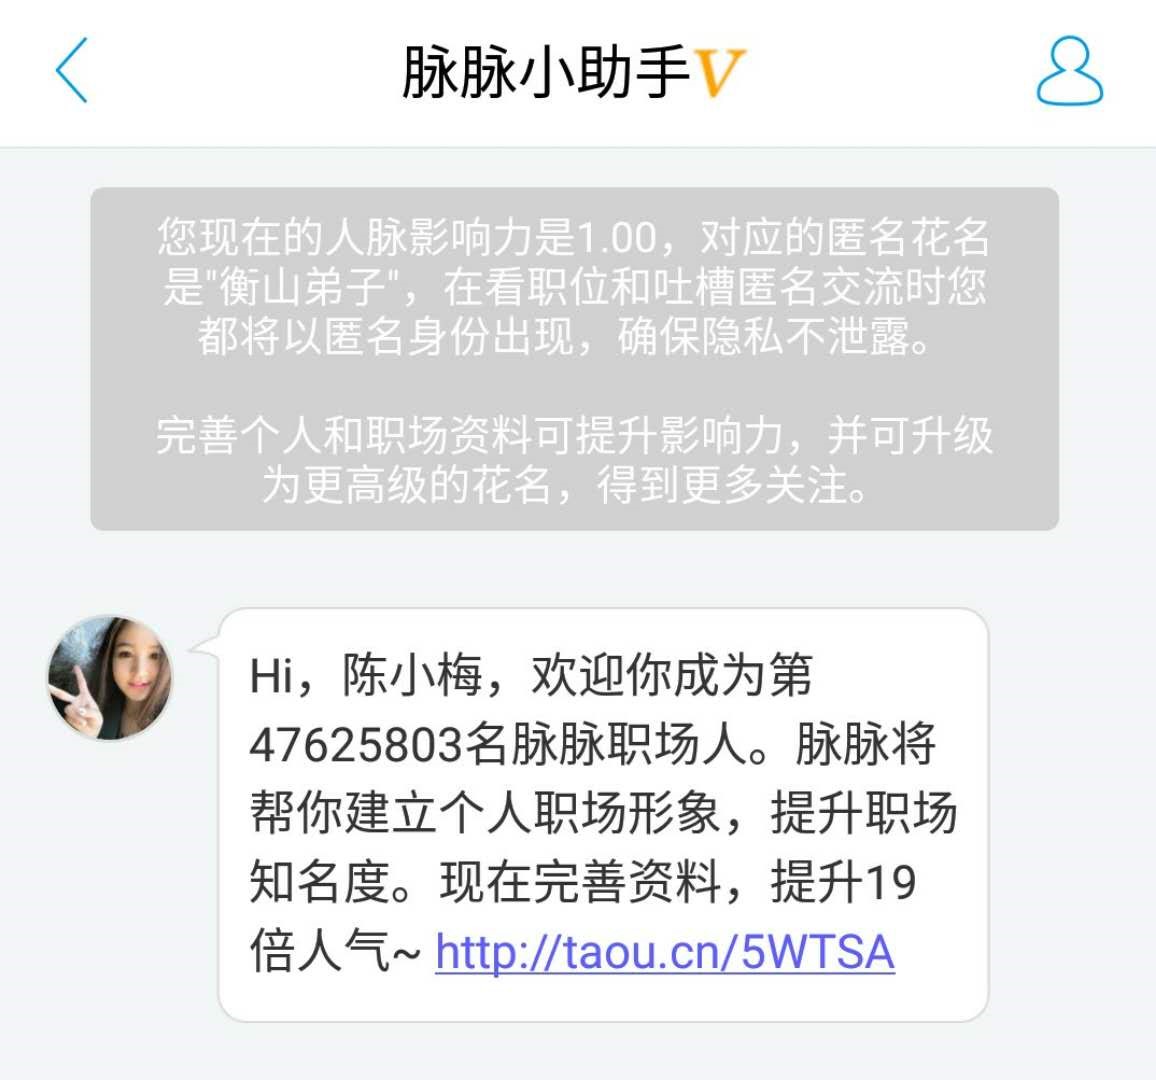
“Why” always comes first, with every push message having a clear goal — to make the user login for the first time or for the user to upgrade?Not only do we need to know the target of the push message, but we need to know what behavioral data we want from the user.These behavioral data are used to measure the impact of push messages on users.For example, after the user logs on to a social APP for the first time, it will receive the following information, which is the push we made to get users to improve their personal data.
2. What:What do we push?
The content of the push messages have the following three characteristics:
(1)Targeted:
Sometimes small details can play a big role.In the example above, we added the user’s name before the message was sent to the user. “Hi, XXX, welcome…”Instead of sweeping to the point: “welcome…Plus the name makes the user feel more approachable.
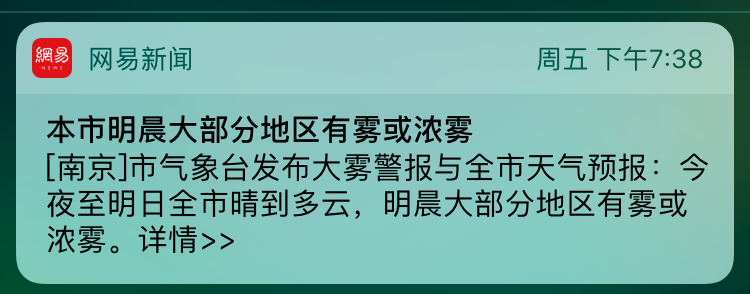
(2)Ensure relevance and timeliness:
Push messages must be timely and highly relevant to users.Netease news, for example, is pushed to the user’s nanjing tomorrow weather news, reflects the correlation between geographical position, this message is to push on Friday afternoon, Saturday’s travel plans to give the reference for the user to remind, the right time.
(3)Accurate and rapid direct user pain points:
The user’s time is precious, and the message we push must get the user to the maximum value.Do not push spam messages to users, or do not match the user’s needs.For example, messages for users who don’t have a car.
3. Who: Who are we going to push the news?
The push message object cannot be cut and cut. We need to divide and manage the user through user behavior data.When it comes to user behavior, here are a few more common user behavior analysis platforms, such as friends union, baidu statistics, etc.But these SaaS platforms also have problems, and the raw data is difficult to export, and the data of their own products cannot be owned by us.It is also easy to recommend Cobub Razor, data private and backstage construction.
Different push messages receive different recipients.
We provide personalized news feeds based on the user’s behavior habits, preferences and so on.For example some music APP users to listen to music for different style, favorite star and collection of song single push related update alert, such precision push has greatly raised the proportion of the user to open the message.
4. When do we push the news?
(1)Time of day:
Can select the user free time, such as before going to work in the morning, at noon to eat, after dinner, specific choice which push period, can according to user’s use time was used to determine, in short not to interrupt the user when user busy or rest.
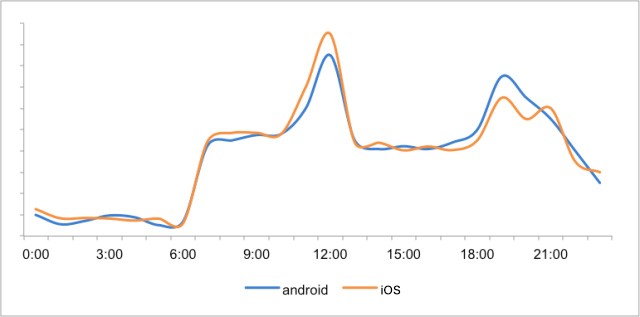
A time period for users of a financial app
(2)Push frequency
Too high push frequency can result in two kinds of results — the user clicks on the push and immediately turns off, or the user simply ignores the message and doesn’t even look at it.The number of push frequency should be determined according to the type of application, generally speaking, the social App can be pushed daily, the information class can be 3-4 times a week, the tool class 1-2 times a week.The number of times should not be too much, otherwise the user will not open up, and probably close the message push, even uninstall the application.
(3)Local time:
Push messages need to be determined according to the user’s local time, this needs us according to the user’s location to determine if your users from all over the world, Beijing time at four o ‘clock in the afternoon when Washington is at four o ‘clock in the morning.If we unified Beijing time to push the news, users in Washington would be disturbed.
5. Where: What situation are we pushing in?
Push scenes can also affect the effect of push messages.We need to consider where the user is when the push message arrives, what he is doing, or what device the user is using when he receives a push message.
We, as users, receive a lot of notifications every day. For example, the taxi app will push express coupons for me on Friday after work.The group purchase app will push the group purchase information of the restaurant near me at mealtimes.If the user is in a disturbed state when they receive a push message, then the user will not be able to look at the push message and take action that we expect.

The messages in the application are pushed based on user behavior, so the effect is better.Regardless of the user, lie sofa eating, no matter the user on the PC, mobile end, as long as we clearly understand the user behavior, according to their behavior push related news, the user is there is a strong possibility we expect action.
Conclusion
The perfect push message must be pre-defined by 5W.Through 5W, we make clear the target, content, object, push time and scene of the push message, so that the user can see the value of the push message to the user.Pushing is the best user touchpoint, and it’s more important to make a thoughtful product that fits the user’s habit than it does daily.
]]>In recent years, data analysis has developed rapidly and we have also made a micro data analysis tool.The product has been successfully operated for three years, fulfilling the daily life of millions of enterprises.The product structure is very simple, with the simplest language in the world PHP, the most common database mysql, the server can choose apache or choose nginx, all your own preferences.
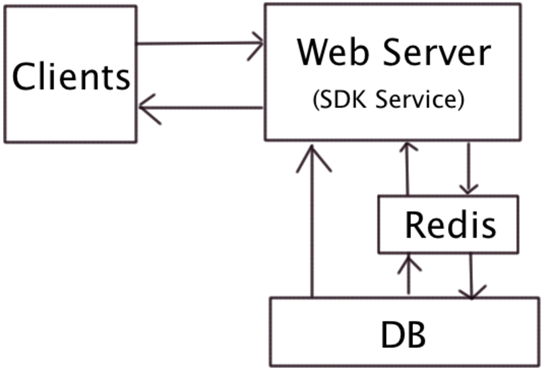
1. Microservice architecture diagram:
Three Years Running, a Million Micro-service Data Analysis Framework,首發(fā)于Cobub。
]]>In recent years, data analysis has developed rapidly and we have also made a micro data analysis tool.The product has been successfully operated for three years, fulfilling the daily life of millions of enterprises.The product structure is very simple, with the simplest language in the world PHP, the most common database mysql, the server can choose apache or choose nginx, all your own preferences.
1. Microservice architecture diagram:
Whole flow chart:
(1) The SDK uploads data to the server, and if redis is installed, the data will be advanced to redis and then periodically extract the data to the DB server. Redis can greatly improve parallel data processing capabilities.
(2) The database collects raw data, and the stored procedure calculates the data according to different dimensions according to different dimensions, and the data summary table.
(3) Front desk report presentation, real-time report, hour report and day report data display. It’s better to write and separate.
2. Functional framework
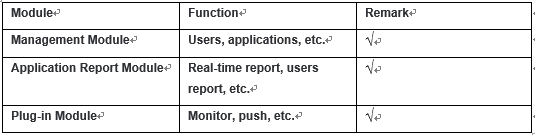
The functional architecture includes functions, roles, and permissions. The function is enterprise service, the user USES each function, is the enterprise every service. The role is the user action category, the function and the role’s correspondence and permissions. Understand the status of the system architecture and start with the functional architecture.
3. Application framework
The application architecture includes existing architecture diagrams, web application status, and interface architecture. Among them, the interface is the key to the application layer, which is the interaction between programs.
The main interface includes clientdata usinglog event and errorlog, etc.
The SDK sends data to the background periodically through the interface.
The application architecture lists the end-to-end invocation relationships.
4. Data design
Two databases, about one hundred tables. The design of the database relies on business data, classifies business data, and results in an E_R diagram of data design. The data design is completed and the final database design comes out. As long as early design of the database, it can be easy to scale, easy to split. Statistical classes are mainly divided into statistical dimensions, which are user, device, error information, etc.
(1) Data handling capacity
The number of live millions, the number of launches is about two million, and the number of events and page views is at least 300 to five million, with an average of 500,000 data per hour. During operation, the customer data volume is concentrated in the morning and evening peak. According to the special situation of customers, some tasks are arranged in the leisure time, such as daily tasks, weekly tasks, monthly tasks, etc. Good hardware configuration is a good helper for data processing, and larger memory faster drives can definitely make data flow fast.
(2) Data cleaning and read-write separation
A large amount of raw data is entered into the database, which is then processed into garbage data. When all report data is counted and writes to the various dimension tables, the data needs to be removed periodically.
The front desk report shows that data is best separated from the storage analysis database.
5. Physical Schema
A microservice’s physical architecture requires very little machinery, and a machine can run. Analysis statistics is mainly about data processing ability, the database server needs two, and the web side needs one. Many years of operation result and database processing capacity are the biggest bottleneck of statistical analysis.
6. The direction of continual optimization
(1) Data read and write separation, data cleaning.
(2) Concurrent volume.
7. Customers
Customer’s most important data:
The most important thing for each customer is user table, user’s new status, user activity, user retention. Different customers require different user requirements to determine whether the user is using the machine, and the user has a mapping relationship with the device number and user ID (user number).
Event data is also important, relational conversion rate.
Page access is just as important as events.
Error data can detect bugs in the application.
Different customers, different usage scenarios have different requirements for indicators.
Three Years Running, a Million Micro-service Data Analysis Framework,首發(fā)于Cobub。
]]>