
Outline:
? What is user churn?
? Reducing user loss is a top priority for businesses.
? Ten strategies for reducing user churn.
How to Improve the User Churn Rate ? Here are 10 Strategies.,首發(fā)于Cobub。
]]>Outline:
? What is user churn?
? Reducing user loss is a top priority for businesses.
? Ten strategies for reducing user churn.
Many companies do not have specific plans to activate silent users and recall lost users. Some companies try to replace lost users with new users, while others spend a lot of time analyzing problems and trying to prevent users from losing them.
Before we discuss the methodology for reducing user churn, we need to understand how user churn is defined.
What is user churn?
User churnrefers to the number of users who leave the product within a specified period of time. According to different products and different businesses, the time period is different. The user loss indicator shows the ability of the product to retain users from the side. Companies will pay a heavy price for the loss of their users.
Data talks
When it comes to the impact of user churn, research has done the statistics, and the cost of getting new users is five times the cost of retaining existing ones. The harvard business school report also points out that a 5 percent increase in retention rates can lead to a 25 to 95 percent increase in profit. There are also data suggesting that retained users are major contributors to corporate revenue.

According to gartner, a consultancy, 20% of retained users will contribute 80% of the company’s future revenues. At the same time, the chances of successful sales to the remaining users are 60-70%, and the chances of successful sales to new users are only 5-20%.

The above data shows that reducing user loss and improving retention of users is the most important and beneficial to enterprises (especially e-commerce enterprises).
What are the adverse effects of user loss on the enterprise?
? Reduce enterprise income, affect enterprise performance.
? Lower corporate profitability.
? Improve enterprise marketing and user recall costs.
There are 10 strategies for reducing user churn.
1. Analyze the reasons for user loss.
Why do users lose? The answer also needs to be found in the user, the most direct way is to talk with the user. Phone calls are the quickest way to talk to users. By telephone, we can know that our products do not solve the users’ pain points, what problems we have caused to users and so on. In addition to phone calls, we can also find out the reasons for the loss of users by sending emails to users, inviting users to comment on the website, or interacting with users on social media.
2. Maintain user engagement.
Maintaining user engagement can help prevent user loss to some extent. In order to maintain user engagement, we need to continue to prove the value of the product to the user. In addition to letting users know the main functions of the product and updating the content of the iteration, we can also show users new transaction information, special offers or recent preferential activities, etc.
Previous face-to-face interactions have been the main way for users to participate, but new research shows that websites and social media are becoming the main ways for users to participate.

Getting new users involved in the product is also a good way to reduce user churn. For example, we can ask new users about the first impression of the product, which helps us understand the initial impact of the product.
3.Give users adequate guidance.
Reducing user churn can be achieved by providing users with high-quality guidance/support information. These guidelines include but are not limited to free training, online BBS, video guidelines or product demonstrations. Good product functionality with enough guidance not only gives users the tools to solve problems, but also gives users a guide to the tools they use. The greatest potential of our products and services is to let users feel that we are paying enough attention to them and that it is not so easy for users to leave their products.
4. Timely detection of users on the edge of loss.
Data from the past loss of user behavior through the analysis, we can come to the conclusion that some loss of user joint behavior, such as they lost before that time is not as active as ever, loss and puts forward some problems to us before but didn’t get our feedback and so on. By identifying these common features, we can predict users who are on the edge of loss and take appropriate measures to retain them.
5. Identify high-value users.
Identifying high-value users and prioritizing the needs of these users is important because our revenue is primarily contributed by these high-value users. There are two ways to identify high-value users: one is to analyze the engagement of users in each stage of the product life cycle, and the other is to group users according to user behavior. We can have a high degree of engagement at each stage of the product life cycle, and the user group that often implements the purchase behavior is considered a high-value user group.
When analyzing user engagement and the behavior of different user groups, we can not only identify high-value users, but also identify users who are on the edge of loss. In other words, we can also predict the loss of users as we determine the high value users.
6. Incentive
There are many ways to motivate users, such as preferential activities, points exchange, etc. In incentives to retain on the verge of losing users or recall has been lost, we must ensure that these measures cost consumed less than these users to our contribution to profits. We can’t afford to waste a lot of human resources to save those who won’t contribute a dime.
7. Target users.
In As A Product Manager, Do You Really Understand the Data Analysis?,We have a product vision – the product must be targeted. After all, the target user is barking up the wrong tree, even if we make the most of it and we can’t let the user stay. If we use words like “free” and “cheap” to attract new users, our new users may not be our target users at all. Those who collect freebies are the most likely to lose. Our target users should be users who value the long-term value of our products, not those who are greedy and cheap.
8. To provide better service to users.
Poor service can lead to loss of users. There are two main reasons for the loss of users: one is incompetent and rude staff, and the other is that the service is too slow to be tolerated. More than 70 percent of the lost users are lost to bad services.

The image above shows the importance of user service. Any service that makes users dissatisfied can lead to loss of users.
9. Value user complaints
The product problem exposed by user complaints is only the tip of the iceberg. According to the survey, 96% of users will not be satisfied even if they are dissatisfied with the product, and 91% of them will leave without a word. Only 4% of users will complain about the product!

Therefore, we must take users’ complaints and complaints seriously and give timely feedback. Research shows that users who receive feedback and solutions are more likely to become loyal users, who can spread our products or services to form a good reputation.
10. Show our competitive advantage.
We need to make it clear to the user that we are different from our competitors; Where we stand out; If users don’t use our products, they will miss something. Knowing these problems, we can see what our competitive advantage is. After knowing the competitive advantage, we can hype it up!
We’ve talked about 10 strategies to reduce user loss, and we want to help the people who run the APP.
How to Improve the User Churn Rate ? Here are 10 Strategies.,首發(fā)于Cobub。
]]>Why Can’t You Help Clicking It?,首發(fā)于Cobub。
]]>How exactly is this habit developed?
Why do we habitually open an App?
Why do some products stop us from losing our addiction to other products?
Is there any secret to making users more comfortable with your product?

According to cognitive psychologists, the so-called habit is a kind of “unconscious behavior that is produced in the context of the situation”, which we make almost without thinking about it.These days, the products and services we take for granted are changing our every move, and that’s what the product designers were trying to do.That is to say, our behavior has been designed unconsciously.
How do these companies manage to influence users’ habits and control their thinking with just a few encoded characters on their electronic screens?What are the factors that make people want these products?
Making users develop habits and dependencies is an essential element of many products.Nowadays, more and more enterprises have realized soberly, with only has a huge customer base is not enough to constitute a competitive advantage, the user the product a high degree of dependency is the key to decide its economic value.
So, are you ready to learn more about cultivating positive user habits?And then, looking down, you’re going to get a whole new understanding of the addiction model.
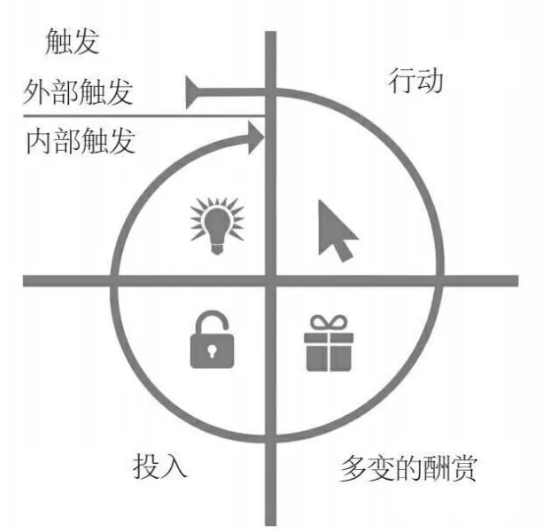
The four stages of the addiction model – trigger, action, variable reward, commitment
Trigger: remind people to take the next step
Triggering is the first stage of the addictive model, which triggers the user to trigger action.There are two types of triggers: external triggers and internal triggers.Let you produce habitual rely on those products are often the external trigger the first to play a role, it is through the information penetration in all aspects of your life to guide you to take the next step, such as email, website links, or the application icon on the phone.
Use an external trigger is just the first step, trigger is the inner core, it through the user memory storage in various association to remind them to take the next step, negative emotions can often act as internal trigger.Develop habits to develop product designers need to consider the user’s psychology, to understand those likely to be internal trigger emotions, and to know how to use external trigger to help users to take action.

Action: the direct response of people when they expect a reward
The trigger is action.If they fail to act, the trigger fails to take effect.Dr Fogg, of Stanford university, argues that to get people to act, three elements are essential: motivation (M), ability (A), triggering (T).I’ll write it in terms of the formula, which is B= MAT.
Triggers remind you to take action, and motivation determines whether you are willing to take action.The motivation for users to use products is based on people’s pursuit of happiness and the avoidance of pain.The pursuit of hope, the avoidance of fear.And because people want to be identified, they hate being rejected.So, as long as your product can give users happiness, hope and identity, it can be the motivation for user action.
With an inner itch (trigger), there is a willingness to tickle, and users can easily “scratch”.The ease of use of the product directly affects the user’s usage of the product.To successfully simplify a product, we have to clear the way for users to use the process.Fogg, summarizes the influence degree of task difficulty of six elements: time required to complete this activity, economic investment, physical, mental, and others on acceptance of this activity, and the degree of match between the activity and routine activities or contradiction.When designing the product, figure out what is preventing the user from completing the activity.Is the user no time, or no money?Is it a busy day and don’t want to think again, or is the product too difficult to operate?To win hearts, you have to make your product easy and easy to navigate.
Therefore, to increase the incidence of preconceived behaviors, the trigger should be obvious, the behavior should be easy to implement, and the motivation should be reasonable.
Changeful reward: satisfy the user’s demand, arouse the desire to use
In the third stage, your product will be able to satisfy users’ needs and arouse their desire to use more.What drives the user to take action is not the reward itself, but the desperate need to be rewarded.The difference between an addiction model and a normal feedback loop is that it can inspire a strong desire for something.The feedback loops around us are not uncommon, but the feedback loops that can be seen in the results do not help to create the inner desire.
The variable reward of “installation” of products is a magic weapon used by the company to attract users.Fundamentally, variable rewards must meet their needs while appealing to users.There is often more than one reward for products or services that can kill users in seconds.Products that don’t have the advantage of being in a variety of variability have to be constantly updated to keep up with The Times.
Social raise reward
The interpersonal rewards obtained through interaction with others.For example, when a friend gets married, he sends out a circle of friends and receives a wave of blessings, which is a social reward.We like our “circle”, enjoy the “likes” of others, and expect “comments” from others.Social rewards can make users crave and expect more.
Prey to reward
Get resources or information.Such as microblogging, microblogging began to attract people, because people as long as the repetition of a “rolling” behavior, can search to the interesting information that oneself like, this is hunting reward mechanism, content variety provides users with unpredictable attractive experience.
Reward yourself
Experience the sense of manipulation, the sense of accomplishment, and the sense of closure.The “upgrade” in the game affects the evaluation of mastery and ability of the self, and the game rules of upgrading and acquiring privileges can satisfy the players’ desire to prove their own strength.Even mundane emails, the number of unread emails in mailboxes are like tasks for many people, a task that needs to be done.
The variable reward is a powerful tool to attract users.Insight into why people habitually rely on products helps designers to design their products well.
Input: through the user’s input to the product, cultivate “repeat customers”
But it’s not enough to get the product to the user’s mind.
A one-night red product often has a good trigger, an easy operation, and a rich social reward.But without the ability to “invest” in a long time, hot style will lose users’ attention over time.
It turns out that the more we invest in things, the more likely we are to think of it as valuable, and the more likely we are to be consistent with our past actions.Finally, we change our preferences to avoid cognitive dissonance.This is the last stage of the addiction model, and it is a stage where users have to invest.The input phase is related to the customer’s expectation of long-term reward, which has nothing to do with timely satisfaction.
When a user provides their personal data and social capital for a product, spending their time, energy, and money is what has happened.In other words, investing doesn’t mean letting users spend money; it means the behavior of the user can improve the quality of subsequent service.Add attention, add to the collection, expand the virtual assets, understand the new product functions, all these are the input that users pay to improve the product experience.These inputs have an effect on the first three stages of the addiction model, and triggers are more likely to form, and action is more likely to occur, and reward is more attractive.
You must say, everything has a routine, then know the routine, how to reverse the pattern?
As a product manager, you can use the addiction model to compare your products:
What do users really need?What pain can your product alleviate?(internal trigger)
What attract users to your product?(external trigger)
What is the simplest operation a user can take when expecting a reward?How do I simplify this operation?(action)
Are users satisfied with the reward, or do they want more reward?(variable reward)
What are the “drips” that users make to your product?Do these inputs help to load the next trigger to improve product quality during use?(input)
If you are a user and learn about these “design patterns”, you can take targeted “anti-design, anti-pattern”.Check your daily actions: what situations do you automatically run on an App?When is the easiest time to swipe your phone?What are the driving forces behind it, to kill time, or to relieve stress?Make a note of it.Find your own behavioral patterns and intrinsic drivers to consciously control your behavior.
文/ 小歐 微信公眾號:中歐國際工商學(xué)院
本文改編自《上癮:讓用戶養(yǎng)成使用習(xí)慣的四大產(chǎn)品邏輯》一書
Why Can’t You Help Clicking It?,首發(fā)于Cobub。
]]>How do we get the push messages to the desired effect?APP operators must pay close attention to the behavior of users, have a clear preference for users' interests, and push the content of interest to different groups of users at the right time.The perfect push messages are valuable to the user, which can help the product to improve the user experience and increase the user's liking.
Who: Object
What: Content
When: Time
Where: Situation
Why: Reason ]]>
How do we get the push messages to the desired effect?APP operators must pay close attention to the behavior of users, have a clear preference for users’ interests, and push the content of interest to different groups of users at the right time.The perfect push messages are valuable to the user, which can help the product to improve the user experience and increase the user’s liking.
Who: Object
What: Content
When: Time
Where: Situation
Why: Reason
Figure out these 5 Ws, then we can push messages satisfying users’ need.
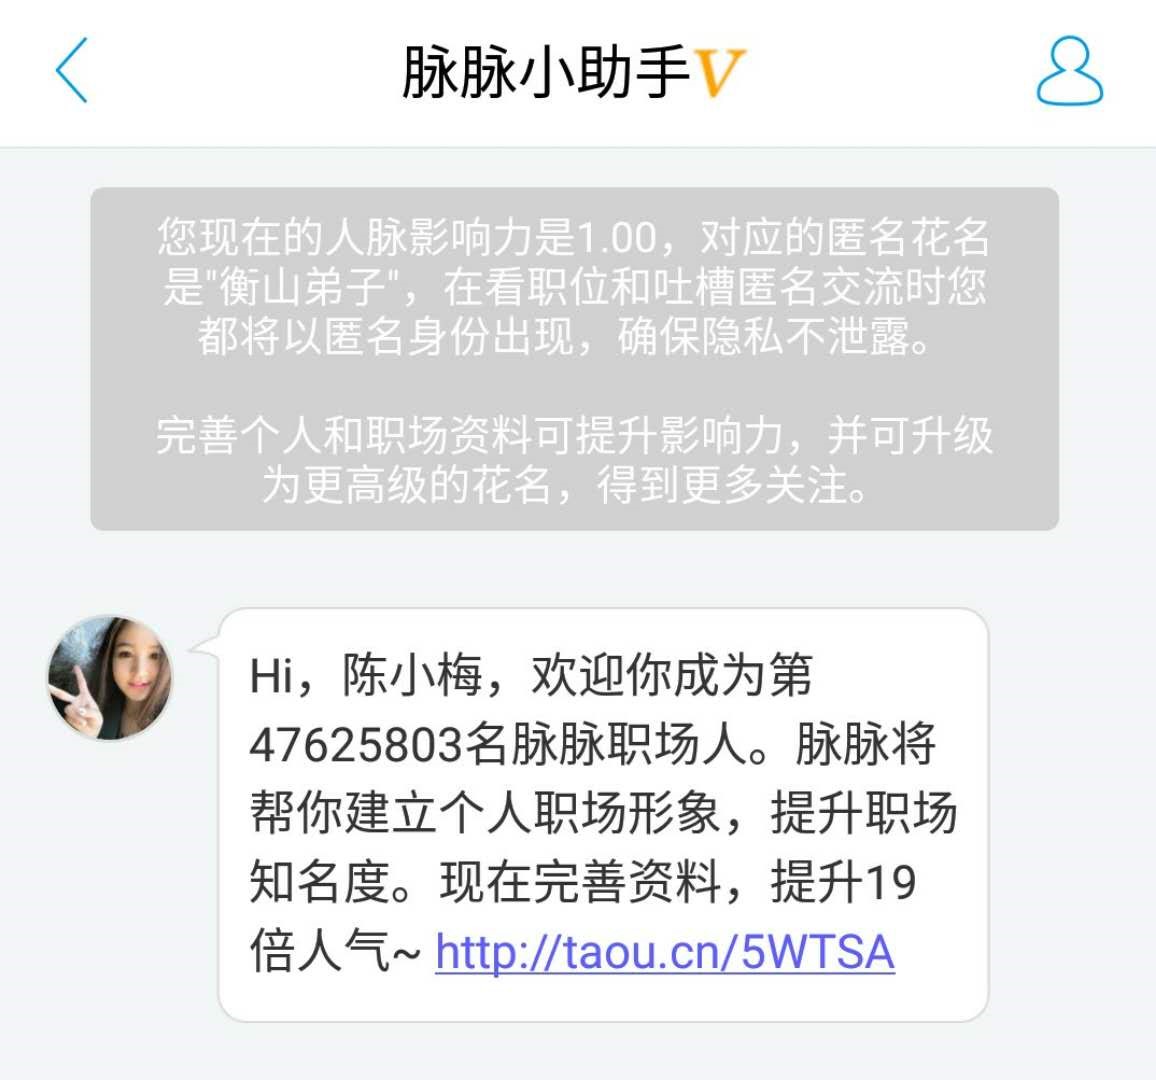
1. Why: Why do we push this message?
“Why” always comes first, with every push message having a clear goal — to make the user login for the first time or for the user to upgrade?Not only do we need to know the target of the push message, but we need to know what behavioral data we want from the user.These behavioral data are used to measure the impact of push messages on users.For example, after the user logs on to a social APP for the first time, it will receive the following information, which is the push we made to get users to improve their personal data.
2. What:What do we push?
The content of the push messages have the following three characteristics:
(1)Targeted:
Sometimes small details can play a big role.In the example above, we added the user’s name before the message was sent to the user. “Hi, XXX, welcome…”Instead of sweeping to the point: “welcome…Plus the name makes the user feel more approachable.
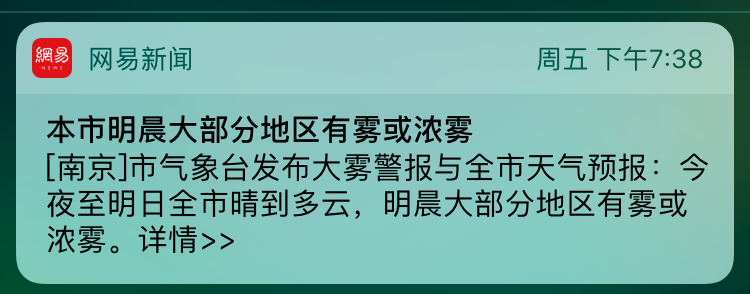
(2)Ensure relevance and timeliness:
Push messages must be timely and highly relevant to users.Netease news, for example, is pushed to the user’s nanjing tomorrow weather news, reflects the correlation between geographical position, this message is to push on Friday afternoon, Saturday’s travel plans to give the reference for the user to remind, the right time.
(3)Accurate and rapid direct user pain points:
The user’s time is precious, and the message we push must get the user to the maximum value.Do not push spam messages to users, or do not match the user’s needs.For example, messages for users who don’t have a car.
3. Who: Who are we going to push the news?
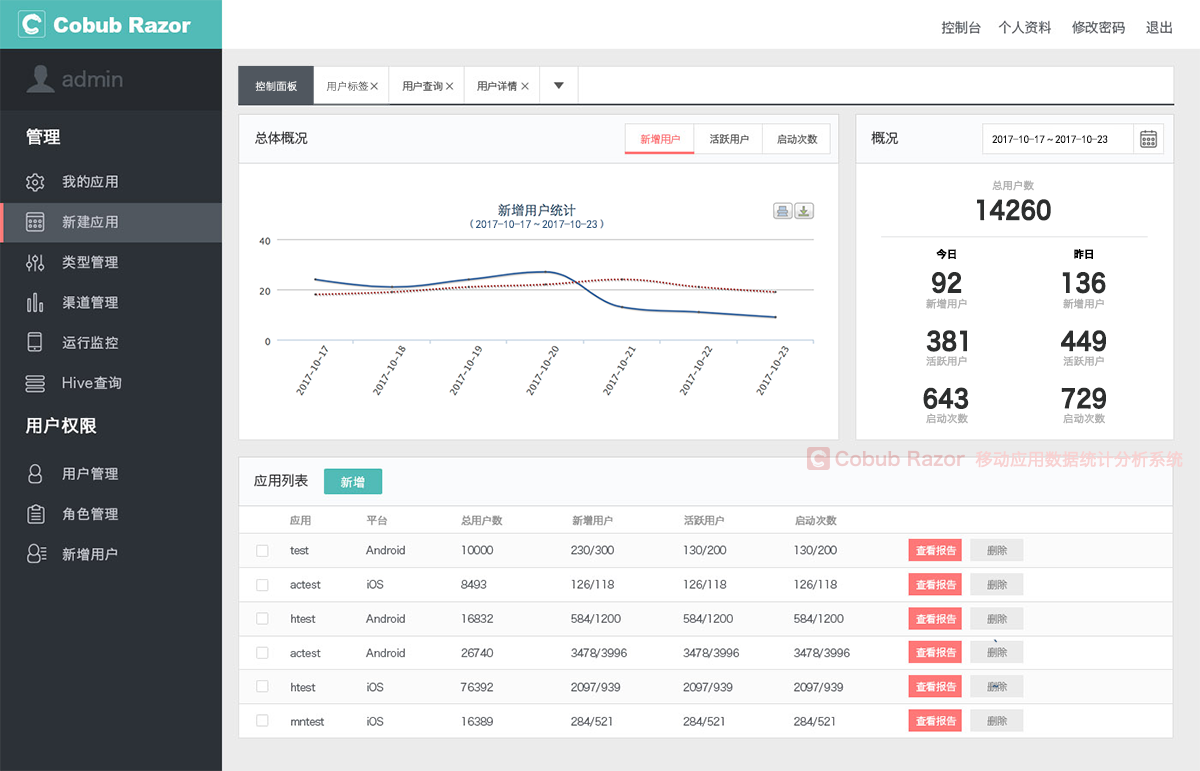
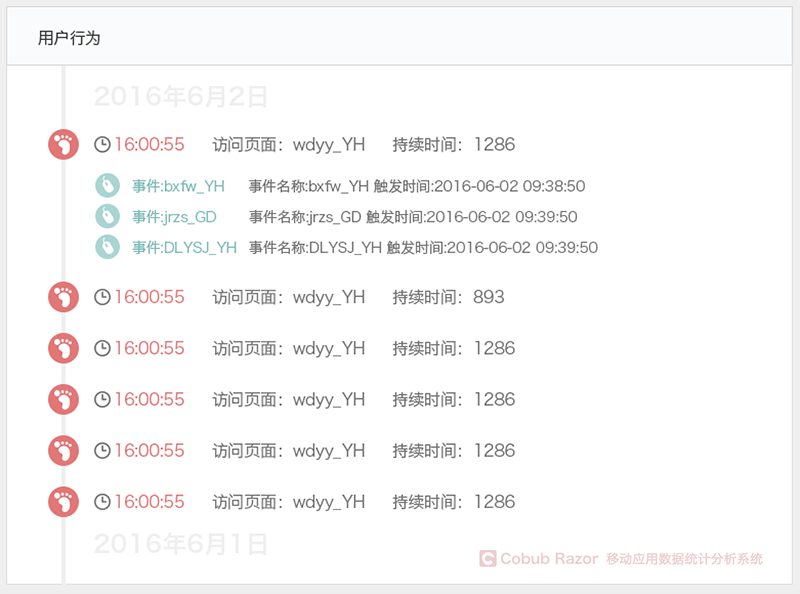
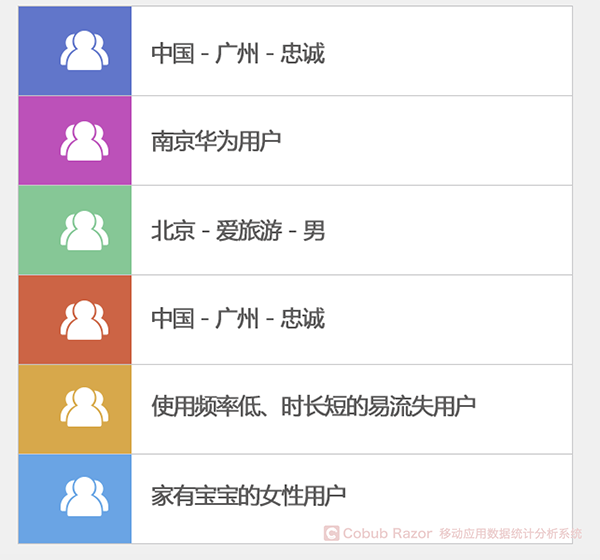
The push message object cannot be cut and cut. We need to divide and manage the user through user behavior data.When it comes to user behavior, here are a few more common user behavior analysis platforms, such as friends union, baidu statistics, etc.But these SaaS platforms also have problems, and the raw data is difficult to export, and the data of their own products cannot be owned by us.It is also easy to recommend Cobub Razor, data private and backstage construction.
Different push messages receive different recipients.
We provide personalized news feeds based on the user’s behavior habits, preferences and so on.For example some music APP users to listen to music for different style, favorite star and collection of song single push related update alert, such precision push has greatly raised the proportion of the user to open the message.
4. When do we push the news?
(1)Time of day:
Can select the user free time, such as before going to work in the morning, at noon to eat, after dinner, specific choice which push period, can according to user’s use time was used to determine, in short not to interrupt the user when user busy or rest.
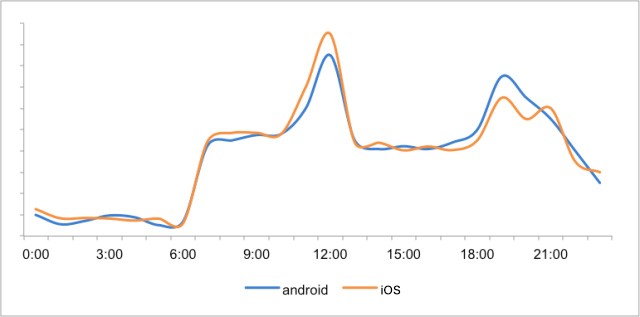
A time period for users of a financial app
(2)Push frequency
Too high push frequency can result in two kinds of results — the user clicks on the push and immediately turns off, or the user simply ignores the message and doesn’t even look at it.The number of push frequency should be determined according to the type of application, generally speaking, the social App can be pushed daily, the information class can be 3-4 times a week, the tool class 1-2 times a week.The number of times should not be too much, otherwise the user will not open up, and probably close the message push, even uninstall the application.
(3)Local time:
Push messages need to be determined according to the user’s local time, this needs us according to the user’s location to determine if your users from all over the world, Beijing time at four o ‘clock in the afternoon when Washington is at four o ‘clock in the morning.If we unified Beijing time to push the news, users in Washington would be disturbed.
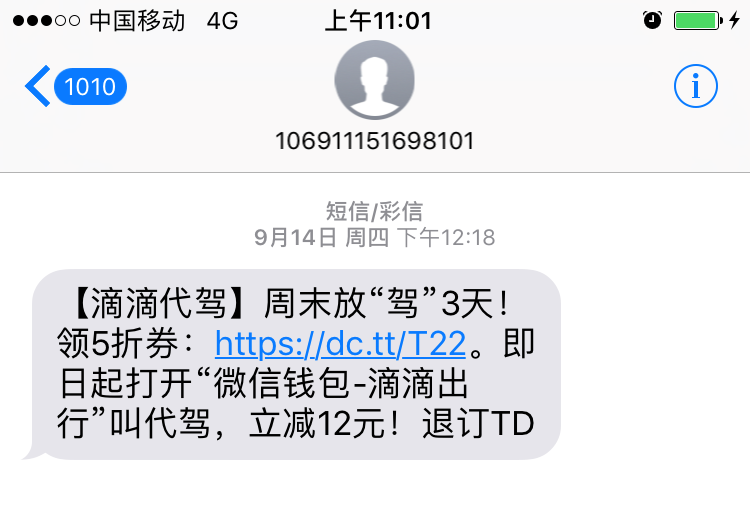
5. Where: What situation are we pushing in?
Push scenes can also affect the effect of push messages.We need to consider where the user is when the push message arrives, what he is doing, or what device the user is using when he receives a push message.
We, as users, receive a lot of notifications every day. For example, the taxi app will push express coupons for me on Friday after work.The group purchase app will push the group purchase information of the restaurant near me at mealtimes.If the user is in a disturbed state when they receive a push message, then the user will not be able to look at the push message and take action that we expect.

The messages in the application are pushed based on user behavior, so the effect is better.Regardless of the user, lie sofa eating, no matter the user on the PC, mobile end, as long as we clearly understand the user behavior, according to their behavior push related news, the user is there is a strong possibility we expect action.
Conclusion
The perfect push message must be pre-defined by 5W.Through 5W, we make clear the target, content, object, push time and scene of the push message, so that the user can see the value of the push message to the user.Pushing is the best user touchpoint, and it’s more important to make a thoughtful product that fits the user’s habit than it does daily.
]]>
Every product manager knows that data analysis is important, but can you give a clear answer to both of these questions?
1. What is data analysis?
2. Why is data analysis so important?
It doesn’t matter if you don’t know the answer, because this article is about to answer it from the following aspects:
1. What is data analysis?
2. Relevant concepts of data analysis
3. How to conduct data analysis?
4. How to measure and collect data?
5. How to do data analysis report?
6. The relationship between data analysis and products
As a Product Manager, Do You Really Know about Data Analysis?,首發(fā)于Cobub。
]]>Every product manager knows that data analysis is important, but can you give a clear answer to both of these questions?
1. What is data analysis?
2. Why is data analysis so important?
It doesn’t matter if you don’t know the answer, because this article is about to answer it from the following aspects:
1. What is data analysis?
2. Relevant concepts of data analysis
3. How to conduct data analysis?
4. How to measure and collect data?
5. How to do data analysis report?
6. The relationship between data analysis and products
What is data analysis?
In short, data analysis represents product status, user behavior, and what users click on and so on. Although the data represents the state of the product, it does not indicate the cause of the state of the product. Data analysis cannot rely solely on a single measurement data, which should be based on a series of converging data.
For example, if you want to analyze the state of an object, we can’t use temperature only, you have to combine other data like position, velocity, composition, environment temperature etc. to implement data analysis. Suppose the velocity is 0, the object is 1 meter above the ground, and the surrounding temperature is the same as the object, and you can conclude that the object is static.
Similarly, when you analyze product status and user behavior, the more metrics you gather, the better for you.
Relevant concepts of data analysis
To get the most out of data analysis, you need to be very knowledgeable about the concepts of data analysis. These concepts include:
? Data points
? Segmentation
? Funnel
? Cohorts
Data points
Data points, the single point of data. A data point measures a particular project, including measurement data and time.
Accurate data points are the premise of our chart of product development trends.
Segmentation
Segmentation is based on user’s common characteristics and product usage pattern.
Segmentation is based on but not limited to:
? Technology (browser, operating system, equipment, etc.)
? Behavior (first time visit, return visit, etc.)
? Demographic (language, country, etc.)
If you do not do segmentation by the above characteristics, you have to do it by the ones that can be measured. For example, user gender is a feature that can be measured. As long as we add gender to the user profile, we can collect relevant data.
You can understand the user’s potential behavior patterns through segmentation. Average data masks these patterns of potential behavior. For example, you add first visits vs return visits as the segmentation feature, although the average page views is 2, you find that for first visits, the average page views is 1.2, the average page views of return visits was 3.4. Without segmentation, the difference in page views of first-time visitors and return visitors will be covered by the average page views.
With segmentation, you can focus on the main target user groups. For example, if your target users are located in eastern China, you only need to analyze the user behavior in different provinces in eastern China instead of analyzing users from all around China to optimize the product to adapt to the targeted users’ needs.
Funnel
The funnel model is mainly used for daily data operation and data analysis, such as flow monitoring and product target transformation.
To achieve the goal, the user performs a series of actions. For example, on the e-commerce platform, users will perform the following operations to achieve the purpose of purchase:
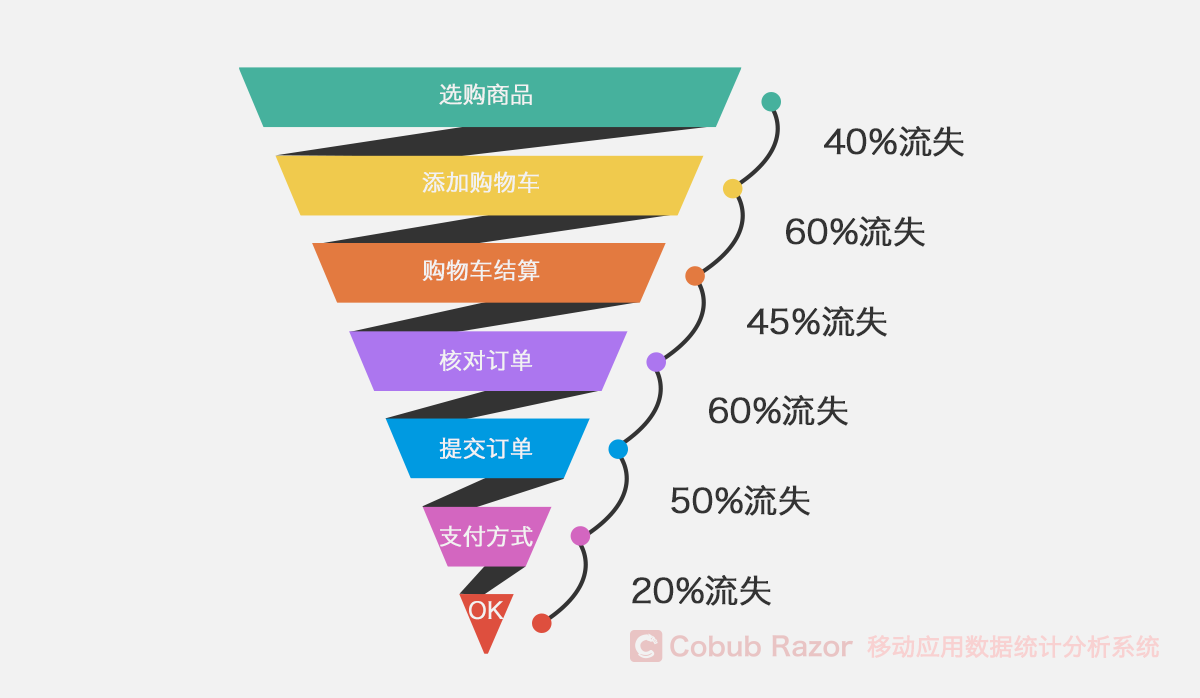
Through the funnel model, we can find out where the user is losing and find out the reasons for the loss through the investigation and analysis.
Cohorts
Cohorts is similar to segmentation, the difference is that cohorts is to compare and analyze user behavior over time.
Cohorts is helpful for measuring the long-time value of users.
Cohorts can compare differently, for example, we can compare a week ago registered users and registered users, a month ago can also compare the registered user of a particular date. If we don’t have a group for a week ago and a month ago, the new user will disturb our analysis of the user behavior during these two periods. When compared to a user of a particular time period, we can measure the impact of a marketing campaign or a product’s function update on user behavior.
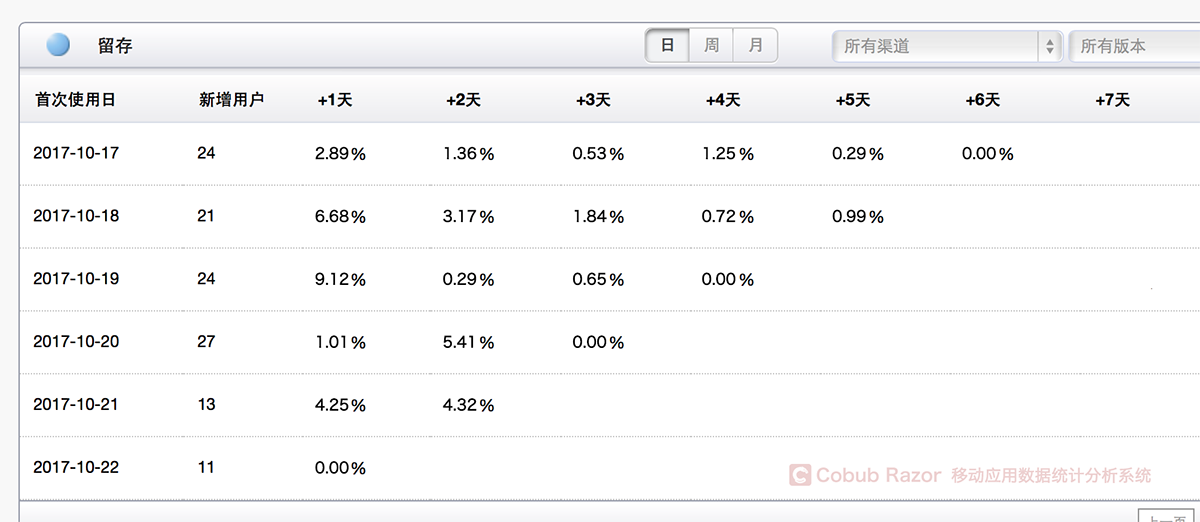
The figure above is a retention diagram based on user registration time. On October 8, the number of users remained significantly higher compared with other users. When we look at this data, we can explore what is causing the change in user retention.
How to conduct data analysis?
Product managers are exposed to massive amounts of data, so how do we perform data analysis? We need to make the following plan:
1. Define product vision
2. Define KPI that meets product vision
3. Definitions allow us to achieve the metrics of KPI
4. (Through user behavior logging) define the funnel that affects measurement
In order to make a better plan, we need to understand the relevant concepts in the plan.
Product vision
Product vision refers to product usage and target users. In short, “what problems does the product solve for users?” Without product vision, all of our next action is a waste of time.
KPI
KPI measures product performance. La new, retained, active, transmutation and so forth are the categories of KPIs. We can also use KPIs to set product development goals, such as increasing user registration by 20% or increasing the purchase conversion rate by 30%. KPIs should be suitable for the stage of the product. If we are just starting out, the main KPI is the user registration, not the user activity.
Metrics
Metrics are the means to achieve KPI. Metrics generally have conversion rate, purchase rate, and so on. By computing two or more data points, we can get metrics. At the same time, the change trend of measurement indicators is also the basis of product improvement.
Funnel
The important funnel will change the metric in some way. After establishing the product use process/user behavior log, we develop the relevant funnel model based on the metrics and user behavior. The funnel model produced by the registration rate and the conversion rate is not possible.
Getting data points
Obtaining measurable data points to achieve KPIs, calculate measurement indicators data, make funnels significant.
The plan is not static, we need to update the plan according to the product vision and KPI.
How to measure and collect data?
There are two methods: establishing an internal analysis system or relying on a third-party analysis system. The internal analysis system can be customized based on metrics. The downside is that we need to build and maintain resources individually.
External analysis systems, such as Google Analytics, Mixpanel, KISSmetrics, etc., are good options. Third-party analysis systems are easy to implement without wasting the resources needed to build and maintain them. Cobub Razor is a professional APP data statistical analysis tool in China, which supports privatization deployment. The data is flexible and safe. It is a good choice.
How to do data analysis report?
Usually we do data analysis reports by making comparison charts and trend charts.
A comparison chart shows a change in a metric between two point points, such as a metric that changed between last week and this week. It allows us to see whether there are large fluctuations in the metric between two time points.
A trend chart shows changes in a metric over a period of time, such as changes in a metric over the past month. It shows the direction of the measure, indicating whether the product is performing — better, worse, or not?
The report identifies the problem and then tries to answer “why does XX happen?” “Why does YY change?” These problems, we can optimize and improve the product.
The relationship between data analysis and products
We improve the product according to the data analysis results. If there is no data analysis, we can easily change the product blindly and make head decisions. If there is no data analysis, we cannot know the effect of product change. In the process of product development, we need to constantly conduct data analysis to ensure that our products are developing according to our expectations.
To ensure that products are in a leading position, product managers must know what data analysis is and the importance of data analysis. Hope this article can be helpful to the general product manager.
As a Product Manager, Do You Really Know about Data Analysis?,首發(fā)于Cobub。
]]>